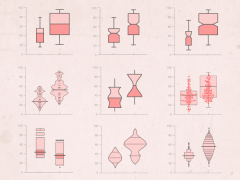
While I’ve already covered Box Plots, there are a series of Box Plot variations that can display the distribution of data over two, three or even more dimensions.
Data Visualization
Posts related specifically to the subject of data visualization.
Originally introduced and popularised by the American mathematician John Wilder Tukey, a Box Plot (also known as a Box and Whisker Plot) is a type […]
As I advertised a few months ago, I would provide a talk at the design conference Designers Fiesta on the subject of expanding ones data […]
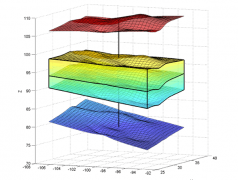
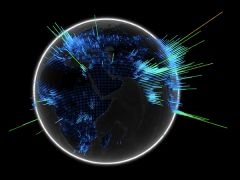
In the last two posts (#1 and #2), I specifically looked a range of 3D charts, but didn’t included any 3D maps to display geographical […]
In Further Exploration #1, I looked at charts that visualise data in 3D. In this post, I will continue to showcase and catalogue the different […]
While it appears that I’ve covered a huge number amount charts on the main page, there is still an abundance of different charts out there that I have […]
Back in 2015 I contributed a series of blog posts to Visualoop that looked deeper into each of the chart type I had already covered by […]
The Data Visualisation Catalogue isn’t the only library of data visualization methods out there. A number of individuals have also taken it upon themselves to […]


