A visualisation method used to represent a 3D plotted surface onto a 2D graph.
Chart Combinations
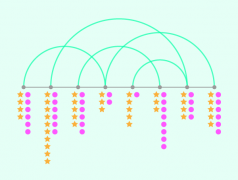
Here’s a list of different charts that can be combined with an Arc Diagram to display additional data.
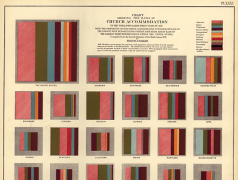
Here are 34 different charts that you can combine a Proportional Area Chart with.
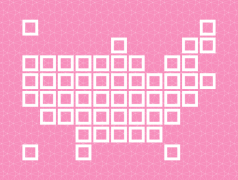
I wanted to document all variations of Tile Grid Maps that I’ve come across and also draw combinations that I think are possible.
I recorded an online interview with Finn Fitzsimmons explaining his projects in more detail.
Here I’ve demonstrated and experimented with 30+ ways you can combine a timeline with other forms of data visualization.
This is my first post touching on the phenomenon I’ve observed of which I like to describe as ‘Fusion Charts’ and ‘Chimera Charts’.
Here will I look into visualizing data in calendars by experimenting with different combinations of calendars with other types of charts.


