 Page top
 Previous
 Homepage
 Next
Next
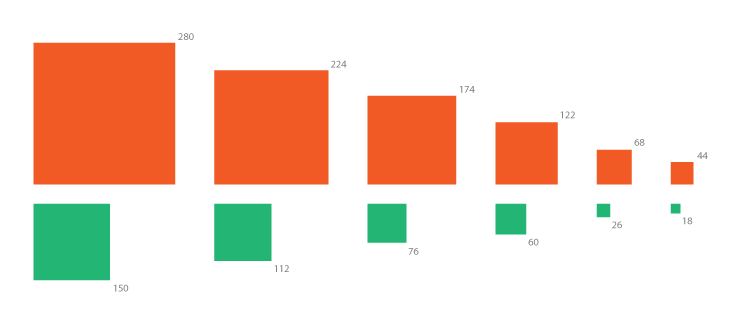
Proportional Area Chart
Description
This chart is great for comparing values and showing proportions (in sizes, quantities, etc.) to give a quick, overall view of the relative sizes in the data, without using scales.
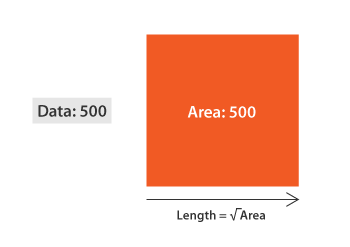
Proportional Area Charts usually use squares or circles. However, any shape can be used, so long as you use the shape’s area to represent the data. A common technical error with area charts is using length or height to determine the shape’s size. Instead, you need to calculate the space inside the shape (its area) to determine the size. Otherwise, you will cause exponential increases and decreases.
The downside to Proportional Area Charts is that they're difficult to accurately estimate values from. Therefore, they are typically used for presentational purposes rather than analysis.
Functions
Anatomy

Tools to Generate Visualisation
Code-based:
D3.js Graph Gallery (D3.js)
Observable (D3.js)
Python Graph Gallery (circlify + matplotlib)
R Graph Gallery (R: ggplot2)
Vega
Webapp:
Datylon
LivingCharts
Desktop App:
Tableau
Examples
...
