An improvement over the traditional Box Plot that provides a more informative display of the data distribution shape.
Posts related specifically to the subject of data visualization.
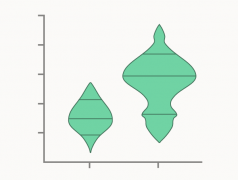
An improvement over the traditional Box Plot that provides a more informative display of the data distribution shape.
A variation of the standard Box Plot where the width of the box is proportional to the size of the group or data subset being represented.

A combination of a Radar Chart and a Box Plot that enables the comparison of multivariate data across multiple classes or clusters.

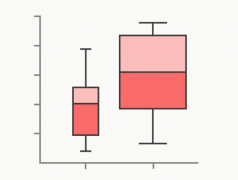
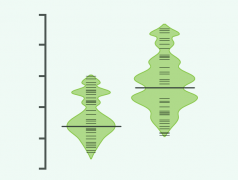
A variation of the classic Box Plot used to display the data distribution while emphasising the median.
A Box Plot variation used to explore and analyse functional data.
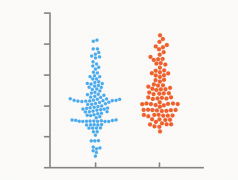
A visualisation that plots data points in a way that resembles a swarm of bees to show data distribution.
Looking at a visualisation used for comparing univariate data distribution between different groups.
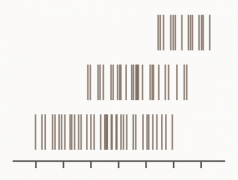
A chart used to visualise the data distribution across multiple categories by plotting short stripes
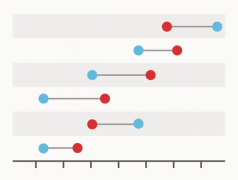
Exploring this visualisation used to illustrate changes between two points in time, conditions, or groups.
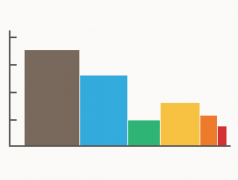
Let’s look at this Bar Chart variation that utilises the width of the bars to visualise an additional variable.
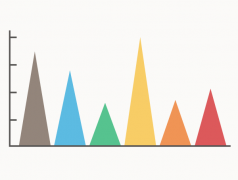
A Bar Chart variation that instead uses triangles as a more novel aesthetic.
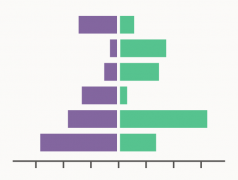
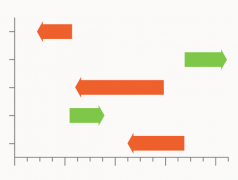
Looking at this Bar Chart variation used for visualising contrasting data series.
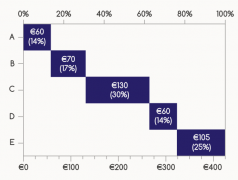
Useful in displaying parts relative to a whole but emphasises the individual segments by staggering them.
Exploring with examples this Bar Chart variation that’s useful for communicating change.
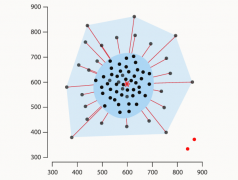
Looking at how Bagplots work, their usefulness, along with some examples.
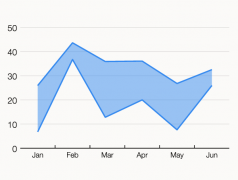
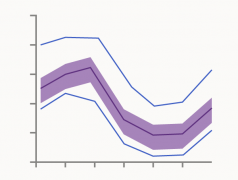
Examining the use of this ranged-focused variation of an Area Graph, along with examples.
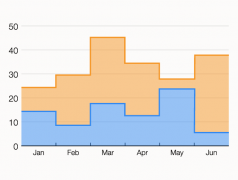
This variation of an Area Graph is used to emphasise comparisons more than the trends.