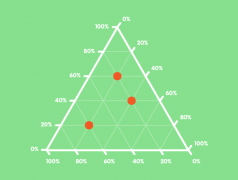
This post explores the various kinds of triangular (tri-axes) graphs that are currently being used. Most notably, Ternary Graphs are their variations.
Chart Types
Posts related to my documented research into the different charts types that I’ve discovered.
While I’m no longer updating the main page with new visualization methods, I’m still continuing to research into different chart types, which you can find in these posts below.
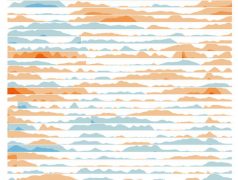
In this post, I will look through the many types of Area Graphs that exist, that I haven’t touched on in the past.
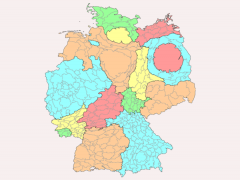
Instead of displaying data over geographical regions, Cartograms communicate data values by manipulating the forms of those geographical regions.
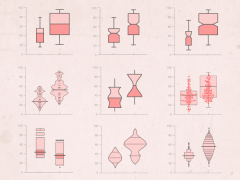
While I’ve already covered Box Plots, there are a series of Box Plot variations that can display the distribution of data over two, three or even more dimensions.
Originally introduced and popularised by the American mathematician John Wilder Tukey, a Box Plot (also known as a Box and Whisker Plot) is a type […]
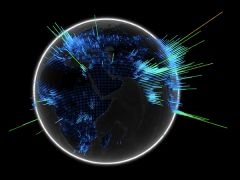
In the last two posts (#1 and #2), I specifically looked a range of 3D charts, but didn’t included any 3D maps to display geographical […]
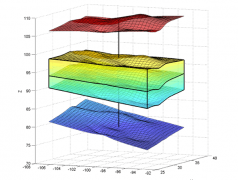
In Further Exploration #1, I looked at charts that visualise data in 3D. In this post, I will continue to showcase and catalogue the different […]
While it appears that I’ve covered a huge number amount charts on the main page, there is still an abundance of different charts out there that I have […]
