Also, demonstrating the usefulness of VR in multi-dimensional data analysis and finance.
3D Charts
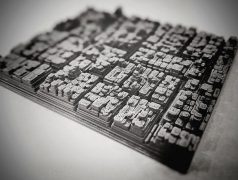
Looking at projects that have used 3D Treemaps that use extrusion to visualise an additional variable.
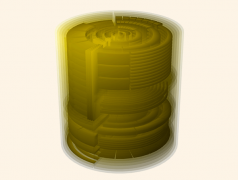
Continuing on at exploring 3D Treemaps, this post takes a look at Treemaps that use spheres or cyclinders in their design.
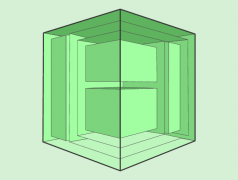
Looking through 3D Treemaps that use a cube design, such as the Information Cube, the Treecube, and the Magic Treemap Cube.
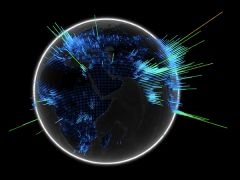
In the last two posts (#1 and #2), I specifically looked a range of 3D charts, but didn’t included any 3D maps to display geographical […]
In Further Exploration #1, I looked at charts that visualise data in 3D. In this post, I will continue to showcase and catalogue the different […]
While it appears that I’ve covered a huge number amount charts on the main page, there is still an abundance of different charts out there that I have […]


