 Page top
 Previous
 Homepage
 Next
Next
Timeline
Description
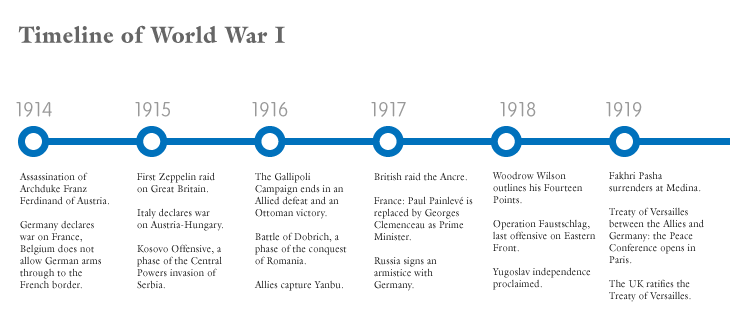
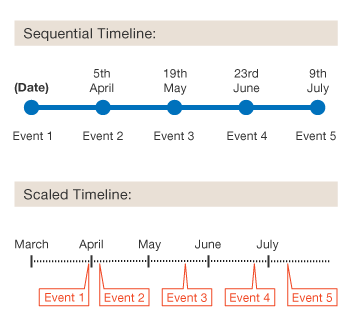
A Timeline is a graphical way of displaying a list of events in chronological order. Some Timelines work on a scale, while others simply display events in sequence.
The main function of Timelines is to communicate time-related information, either for analysis or to visually present a story or view of history.
If scale-based, a Timeline allows you to see when things occur or are to occur, by allowing the viewer to assess the time intervals between events. This allows the viewer to see any patterns appearing over any selected time period or how events are distributed in that time period.
Other forms of data visualisation can be combined with a Timeline to show how quantitative data changes over time. For example, the bars of a Span Chart could be used to show the duration of events. Here is a blog post showcasing a list of Timeline combinations.
Functions
When scaled:
Anatomy
Variations
NoneTools to Generate Visualisation
Code-based:
AnyChart (JS)
Google Charts (HTML5)
KronoGraph (JS)
Vega
Webapp:
Creately
Flourish
Tiki-Toki Timeline Maker
Venngage
Vizzlo
yEd live
Desktop App:
Adobe Illustrator

