 Page top
 Previous
 Homepage
 Next
Next
Tally Chart
Description
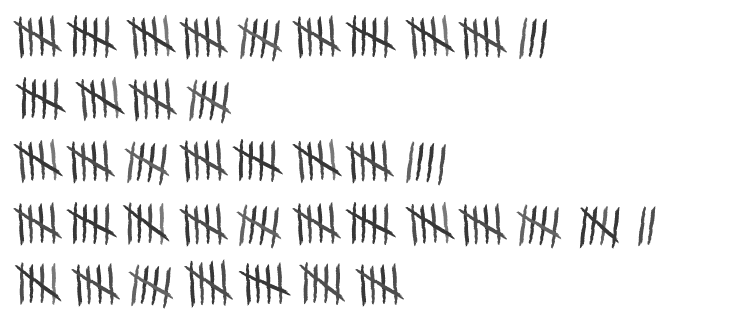
A Tally Chart is both a tool for recording and graphically showing the frequency of the distribution of data by using the tally mark numeral system.
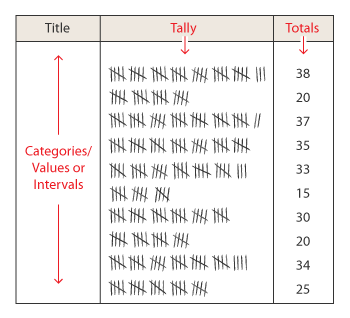
When constructing tally charts, categories, values or intervals are placed in one axis or column (typically the Y-axis or first column on the left). Each time when a value of them occurs, a tally mark is added to the chart in the appropriate column or row. When all the data is collected, the tallies are counted up and displayed in total in the next column or row. The final result is similar to that of a histogram.
Functions
Comparisons
Distribution
Anatomy
Similar Charts
...Tools to Generate Visualisation
Paper and pen (or pencil)
