A Notched Box Plot is a variation of the classic Box Plot, which is used to display the distribution of a dataset, specifically focusing on the median and its confidence interval. In this plot, the part of the box around the median is “notched” or narrowed. The notches serve as a visual indicator of the confidence interval around the median.
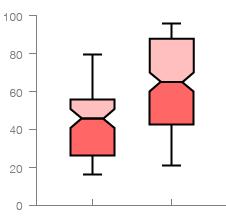
The height of the notches is proportional to the interquartile range (IQR) of the sample and inversely proportional to the square root of the sample size. This relationship means that larger notches indicate greater variability in the data or smaller sample sizes.
The purpose of the notches is to help visually compare medians between different groups. If the notches of the two box plots do not overlap, it provides evidence that the medians of the two groups are statistically significantly different at the 5% significance level.
In other words, a Notched Box Plot more clearly displays the statistical significance of the difference between medians, compared to a regular Box Plot. This makes Notched Box Plots particularly useful when you want to quickly assess whether medians are meaningfully different across groups or conditions.
Tools that can generate Notched Box Plots:
R / ggplot2
Examples
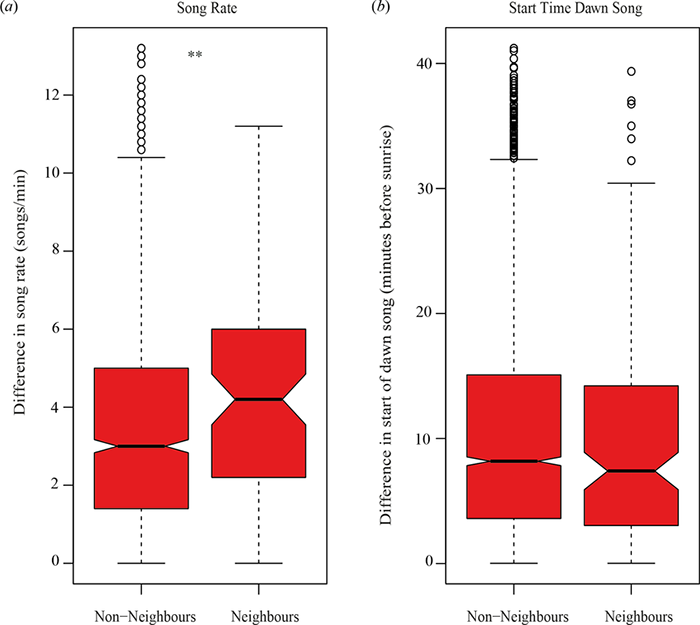
Notched box-plots reveal that (a) neighbours (birds sharing a territory boundary) differ more from each other in median song rate, (b) but not in median start time than non-neighbours do.
Song Trait Similarity in Great Tits Varies with Social Structure
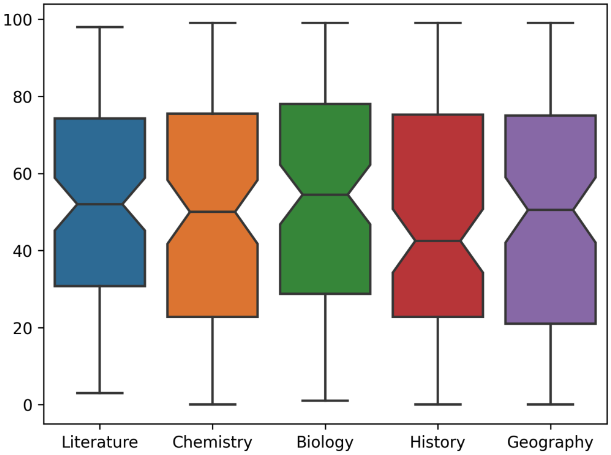
Box Plot of Test Scores.
How to Box Plot with Python — Phyo Phyo Kyaw Zin
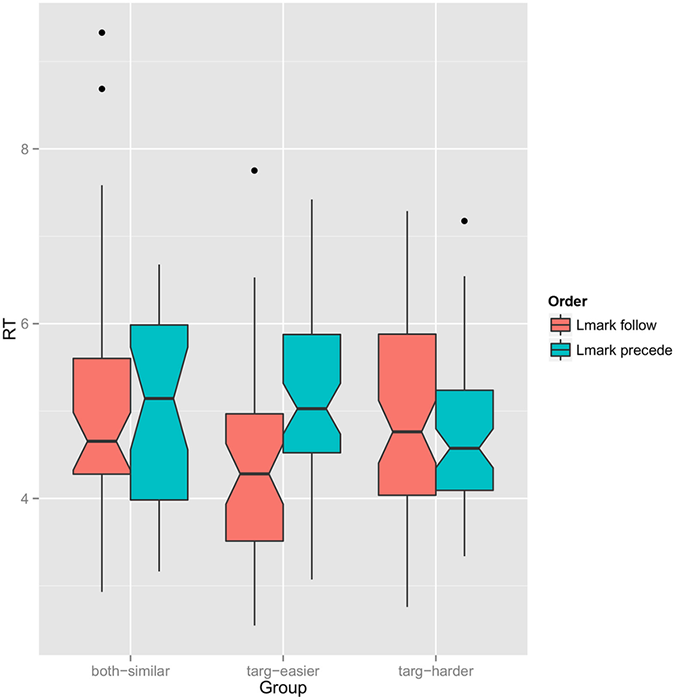
Notched boxplot of reaction time as a function of referring expression order (red: target first, blue: landmark first) grouped by which object is easier to find.
Giving Good Directions: Order of Mention Reflects Visual Salience
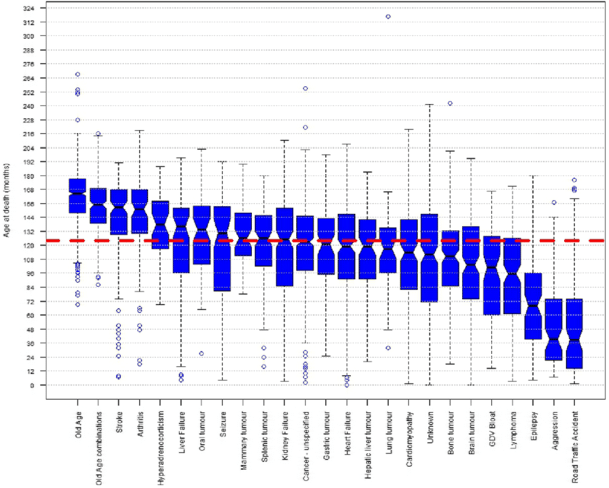
Box and Whisker plot of age at death across common causes of death. Notched Box and Whisker plot of age at death (months) for the 25 causes of death with ≥50 deaths reported.
Longevity and mortality in Kennel Club registered dog breeds in the UK in 2014
A complete guide to box plots — ATLASSIAN
Related posts:
Further Exploration #4 Box Plot Variations
