A Dot Plot (also known as a Wilkinson Dot Plot) is a visualisation that uses dots to plot data points along a value scale. Unlike on a Cleveland Dot Plot, which only plots singular dots positioned along a value axis, Wilkinson Dot Plots plot multiple dots for each category, interval, or time point in the dataset.
In other words, the number of dots plotted in this type of Dot Plot is proportional to the quantities or frequencies in the data. Each dot can represent a unit (a single count) or any number of units (e.g. each dot represents a count of 10).
Dot Plots can be handy for displaying simple comparisons between categories, visualising distributions like on a Histogram, or visualising values changing over time if there’s a time axis.
A “Unit Chart” is practically the same as a Dot Plot, but instead of using dots, it uses any other shape (e.g. a square or rectangle for each unit). When icons are used instead of simple shapes, then this chart can be known as a Pictogram Chart.
Tools to generate Dot Plots or Unit Charts with:
Flourish
Vega
Examples of Dot Plots and Unit Charts
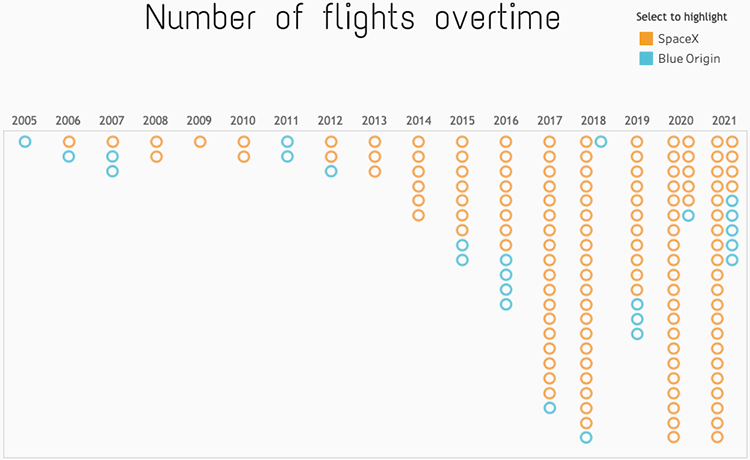
Number of flights overtime.
The billionaire space race – Space X vs Blue Origin, by Irene Diomi
Occupations of individuals portrayed on banknotes.
Who’s in Your Wallet? — The Pudding
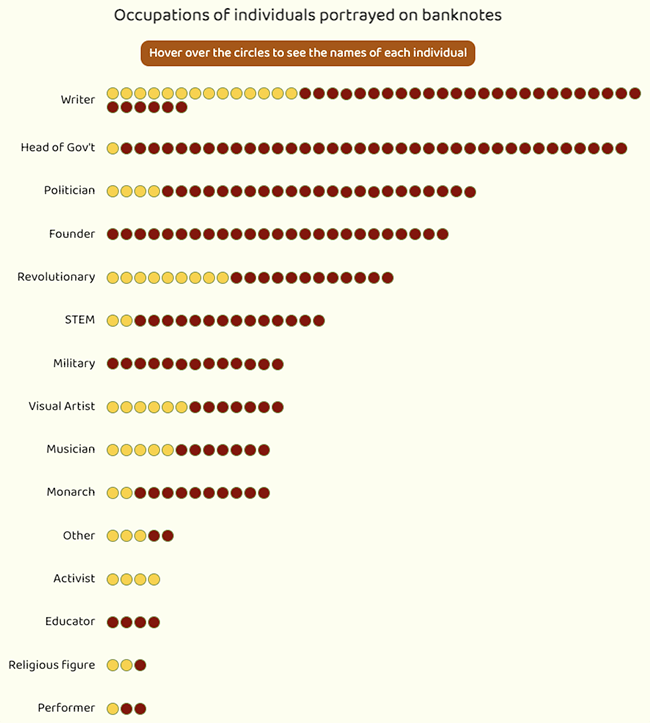
INFOGRAPHICS RSI — Studio Kleiner
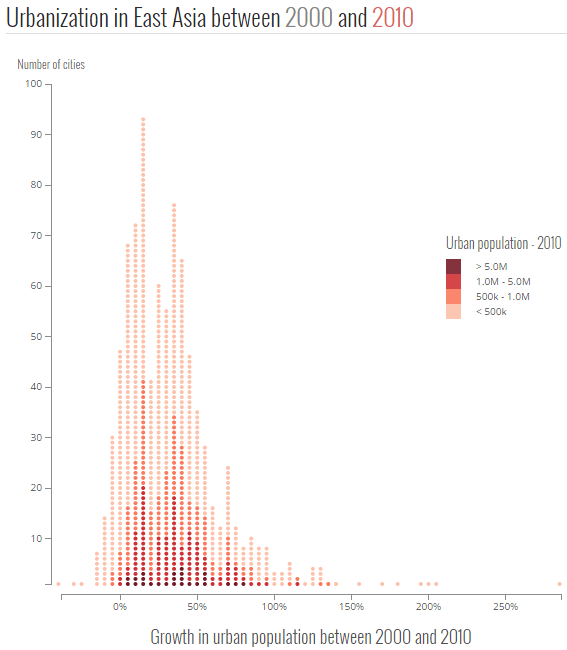
Urbanization in East Asia between 2000 and 2010.
Urbanization in East Asia | visualizing.org winner — Nadieh Bremer
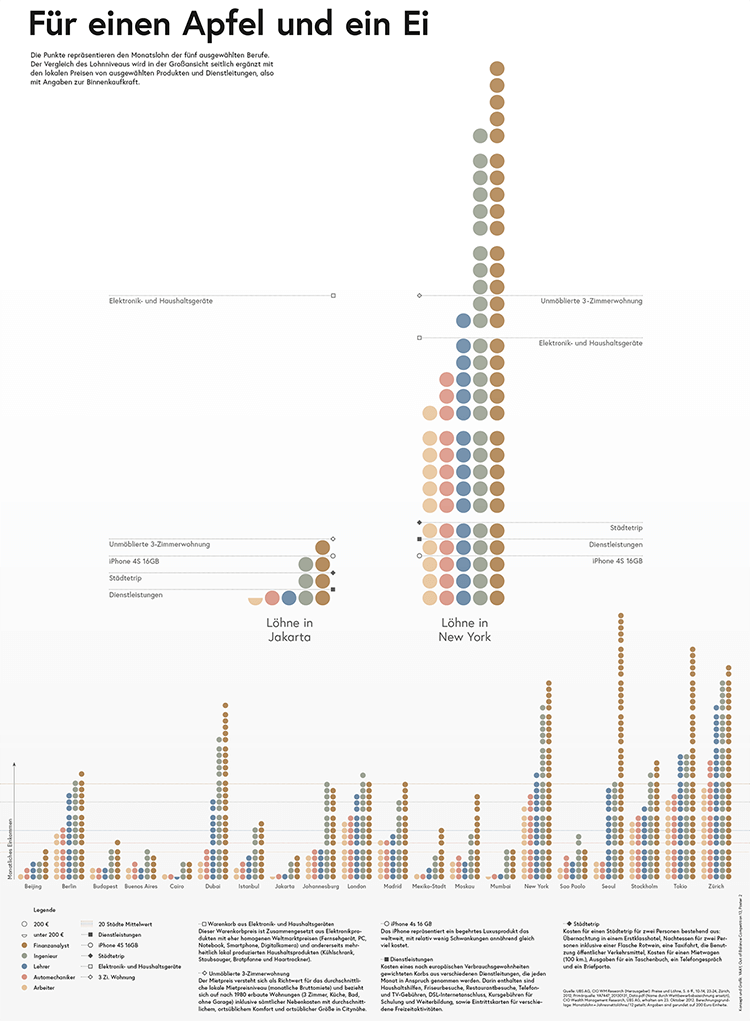
Für einen Apfel und ein Ei.
Data Visualization on Inequality of Society — Superdot Studio
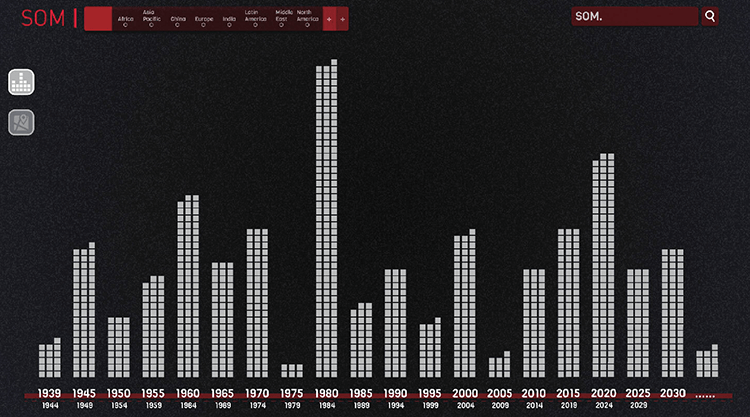
The Power of Architecture.
Hu Yihan, Zhang Yaxin / Nanjing University of the Arts
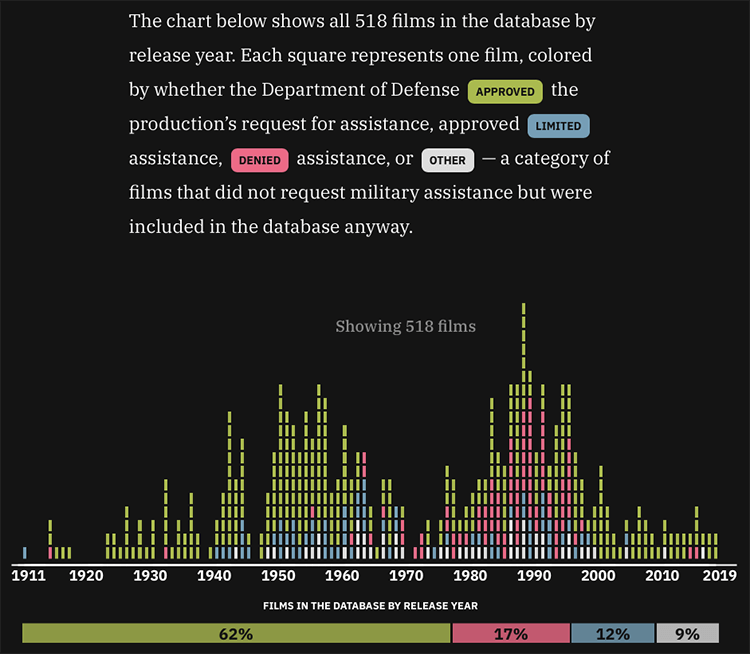
Films in the Database by release year.
Assistance Denied by CUNY Graduate Center
Related posts:
Chart Snapshot: Cleveland Dot Plots
Chart Snapshot: Parliament Chart / Arc-Dot Chart + Examples
