 Page top
 Previous
 Homepage
 Next
Next
Flow Map
Description
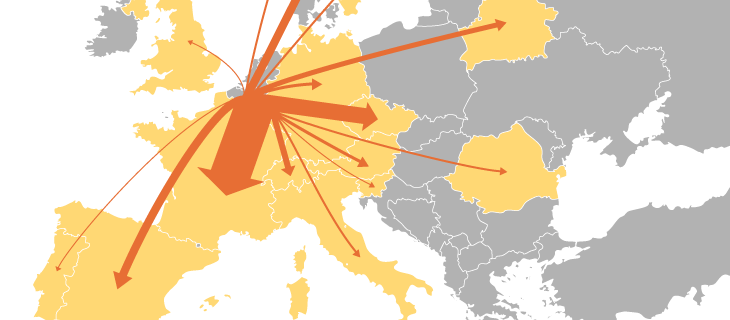
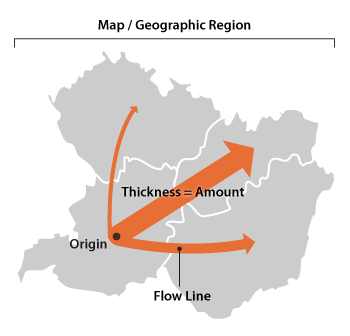
Flow Maps geographically show the movement of information or objects from one location to another and their amount. Typically Flow Maps are used to show the migration data of people, animals and products. The magnitude or amount of migration in a single flow line is represented by its thickness. This helps to show how migration is distributed geographically.
Flow Maps are drawn from a point of origin and branch out of their “flow lines”. Arrows can be used to show direction, or if the movement is incoming or outgoing. Drawing flow lines without arrows can be used to represent trade going back-and-forth. Merging/bundling flow lines together and avoiding crossovers can help to reduce visual clutter on the map.
Functions
Anatomy


Tools to Generate Visualisation
Code-based:
AnyChart (JS)
Webapp:
FlowmapBlue
Examples
Top Chinese Exports to the World - AnyChart Minard's Map of French Wine Exports for 1864 (Wikipedia) Minard's map of Napoleon's disastrous Russian campaign of 1812 (Wikipedia)

