 Page top
 Previous
 Homepage
 Next
Next
Histogram
Description
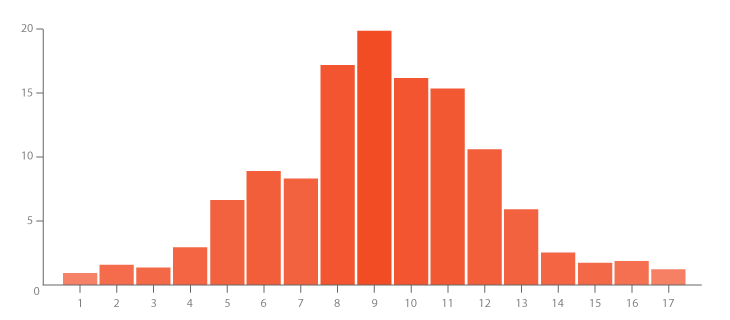
A Histogram visualises the distribution of data over a continuous interval. Each bar in a histogram represents the tabulated frequency at each interval/bin.
Histograms help give an estimate as to where values are concentrated, what the extremes are and whether there are any gaps or unusual values. They are also useful for giving a rough view of the probability distribution.
Functions
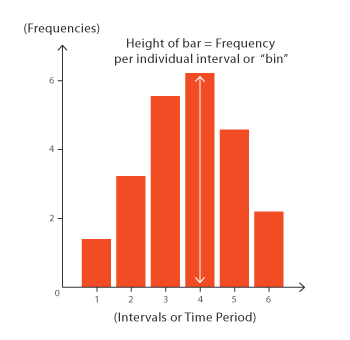
Anatomy


Tools to Generate Visualisation
Code-based:
D3.js Graph Gallery (D3.js)
Google Charts (HTML5)
Mike Bostock’s Block (D3.js)
Plotly (JS)
Python Graph Gallery (seaborn, matplotlib)
React Graph Gallery (React/JS)
R Graph Gallery (R + ggplot2)
Vega
Vega-Lite
ZingChart (JS)
Webapp:
Datavisual
Datylon
Flourish
Google Docs
Infogram
plotDB
Slemma
Desktop App:
Apple Numbers
Microsoft Office, PowerBI
Tableau
Check out our fast-paced, data visualisation-themed card game:

Merchandise & other related dataviz products can be found at the store.

