 Page top
 Previous
 Homepage
 Next
Next
Bar Chart
Description
Also known as Bar Graph or Column Graph.
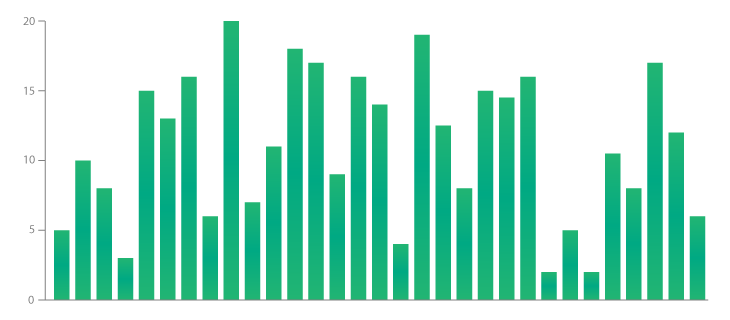
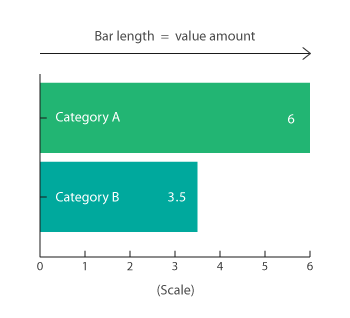
A Bar Chart uses either horizontal or vertical bars (column chart) to show discrete, numerical comparisons across categories. One axis of the chart shows the specific categories being compared and the other axis represents a discrete value scale.
Bar Charts are distinguished from Histograms, as they do not display continuous developments over an interval. Instead, Bar Chart's discrete data is categorical and therefore answers the question of "how many?" in each category.
Functions
Anatomy


Tools to Generate Visualisation
Code-based:
AnyChart (JS)
amCharts (JS)
CanvasJS (JS)
D3.js (JS)
FusionCharts (JS)
Highcharts (JS)
Google Charts (HTML5)
JSCharting (JS)
Plotly (JS)
Python Graph Gallery (Python: matplotlib + seaborn)
R Graph Gallery (R/ggplot2)
Vega (JS)
Vega-Lite (JS)
ZoomCharts (JS)
Webapp:
DataHero
Data Illustrator
Datamatic
Datawrapper
Datylon
Flourish
Google Docs
Infogram
Online Charts
PlotDB
RAWGraphs
Slemma
ZingChart
Desktop App:
Adobe Illustrator
Apple: Numbers / Keynote / Pages
datylon (Ai Plugin)
Microsoft: Excel / PowerPoint / Word / PowerBI
Tableau
Check out our fast-paced, data visualisation-themed card game:

Merchandise & other related dataviz products can be found at the store.

