As I’ve started looking into data visualization in VR, I wanted to have a look at what was currently on to offer in terms of VR data visualization solutions. Already, there are quite a few start-ups on the market offering to bring data visualization to the VR realm. Although, all the action seems to be happening only in the USA (for now).
3data
Initially known as ‘DatavizVR Inc.’ this company in 2016 released the demo version of their app DatavizVR to Steam, which was my first experience of data visualization in VR. They have since rebranded themselves as ‘3Data’ and now offer solutions in both VR and AR.
BadVR
Based in Santa Monica (CA), BadVR offers to provide next-generation DataViz VR solutions, with a focus on providing new standards for exploring your data in immersive environments. Scrapping the idea of charts and graphs, they present data in new ways, with a focus on collaboration and real-time filtering. BadVR also employs the aid of artificial intelligence and machine learning to help parse through large datasets and for analysis.
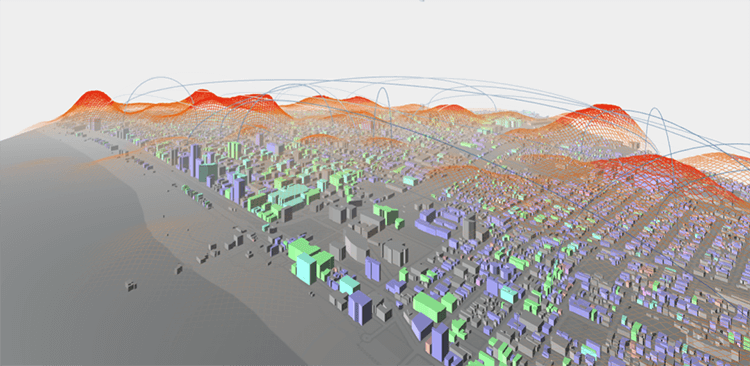
Source: BadVR – Screenshot of geospatial data visualization
Virtualitics
Another company on the scene is Virtualitics, whose patented company technology is based on a decade of research at Caltech and NASA/JPL. Operating from Pasadena (CA), Virtualitics offers a DataViz VR solution that’s combined with machine learning and collaborative working.
Ulysses
Based in Seattle (WA), Ulysses offers VR data visualization solutions for big data.
Just a screenshot of what is going on with ULYSSES: Peeking inside a complex dataset… pic.twitter.com/b9s0ksGkkm
— VR Ulysses (@Ulysses_VR_Data) October 20, 2018
Virtual Cove
The Natick (MA) based company, Virtual Cove offers to turn big and complex data into VR and mixed reality experiences.
#trading based on 1820 screens’ perspective distilled as one in #VR #AR using @VirtualCove pic.twitter.com/H1ZSdME5t7
— Virtual Cove (@VirtualCove) October 31, 2018
Nanome
With it’s headquarter located in San Diego (CA), Nanome sets itself apart from the rest by being more focused on scientific visualisations, in particular, the ability to analyze, interact with and design molecular data in 3D.
Kineviz
Kineviz is a company based in San Francisco (CA) that develops specialized tools for exploring multivariate and high dimensional data sets, with their main tool being GraphXR. Kineviz are also focused on having VR as their main platform.
Datavized
Datavized is a New York City-based software company that builds data-driven tools for the immersive web. One such tool is Geometric, which allows you to easily build and visualize 3D geospatial data maps without the need to code. Another project Datavized worked on is Immersive 2030, which was presented at the 73rd session of the UN General Assembly.
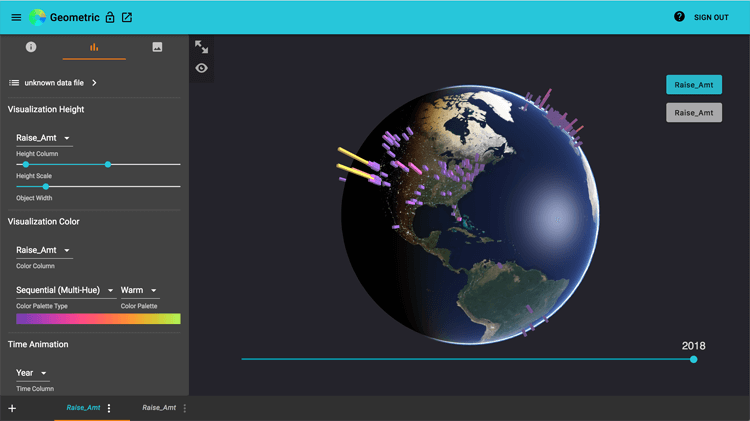
Source: Geometric, Datavized
VR-Viz
Using the React JavaScript library, Mustafa Saifee built a list of components to generate 3D visualization in webVR. This was done by utilizing a combination of both A-Frame with React and D3.js while having a JSON syntax generate the visualizations.
This project is an exception to the rest as it’s non-commercial and openly available on GitHub, and also produced outside of the United States (Mustafa is currently based in Finland).
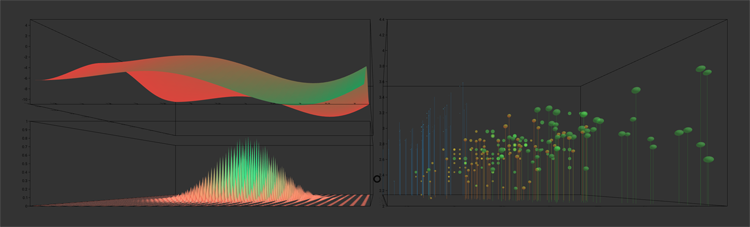
Source: GitHub

