So I’ve started looking into the application of data visualization in virtual reality (VR). It’s something I’ve wanted to cover for a while now as I’ve been curious and I’ve not seen too many people in the DataViz community cover it. I’ve only just begun my research, but I thought it would be good to get down my initial thoughts before I dive deeper in.
While I’m not a massive VR enthusiast and I don’t own a VR headset yet, I’ve had quite a few experiences using VR. A friend of mine who is big on VR tech last spring showed me the DatavizVR app, which I think was in beta version, but from here I managed to get a glimpse of DataViz being using in VR.
Source: International Institute for Analytics
This leads me to be curious about what implications VR has for the field of DataViz. A lot of DataViz experts might scoff at the idea of using DataViz in VR and might dismiss it as hype or being gimmicky. However, I think it’s something worth looking at.
During my bachelor’s degree (in Graphic and Media Design) I actually wrote my final year dissertation on the effects of augmented reality (AR) and ubiquitous computing on graphic design.
So I’ve always been interested in investigating new technologies and their impact on design. AR still isn’t really there yet because of hardware limitations, but VR has exploded in popularity in recent years. So it would be good to find out what the future holds for VR in terms of its application with DataViz and what is its potential. Are there actually any advantages to bringing data into the VR realm?
When working with an emerging new technology and medium (this being the virtual realm) there’s going to be a period of uncertainty in regards to best design practices. Plenty of people are bound to make mistakes at the start, but that’s fine because it’s all part of the developmental process. But eventually, there will need to be some design standards in place.
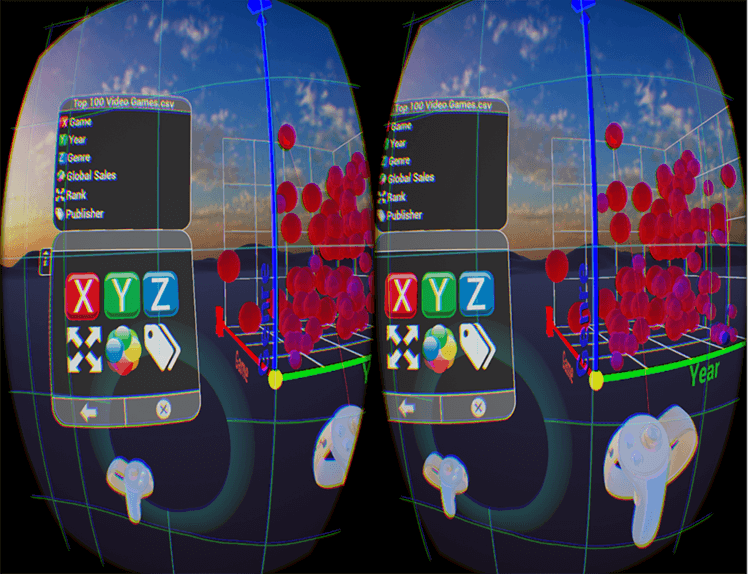
The main problems will probably come for a misunderstanding of human perception. Already I can see from some DataViz VR projects that they suffer the same issues as 3D charts do, despite being in VR and interactive. For example, if you convert a 2D Bar Chart into 3D and simply place it into a VR environment, you still get distortions occurring when you view the chart at different angles.
Maybe it would be better to just display the Bar Chart as 2D but having it follow the user’s eyes as you would have in a head-up display (HUD) dashboard?
Some charts will probably work well being converted into VR while others will be useless.
In the video below, I found the possibility to explore around a Network Diagram (2:00) and the adaption of a Timeline into a ‘rollercoaster’ (7:40) to be interesting solutions.
Another thing that interests me with DataViz in VR, is the emergence of new chart types within VR. Anyone familiar with my work knows I like to catalogue different visualisation types. So keeping an eye on VR would be necessary for my work.
I think it would be also important to look at which industries DataViz in VR will be applied. Already I can imagine the applications in gaming, education, instructional guides, and in medicine. But there’s bound to be other disciplines that can be enhanced with this technology.
So once I have a better understanding of DataViz in VR and more to report back on, I will make another post on this subject. At the moment, I’m currently in talks with companies that already offer DataViz VR services to hear their view on the topic.
Articles
- Human Factor in Virtual Reality Data Visualization
- Data Visualization in Virtual Reality: Useless Hype or Practical Application?
- Data Visualization in Virtual Reality — A VR Demo Project
- Virtualitics raises $7 million to bring mixed reality and big data to the sci-fi future

