Recently, I met (online, through Twitter) Suzanne Borders who had gotten in touch with me after I started posting about my interest in data visualization in virtual reality (VR). I found Suzanne to be exceptionally knowledgeable, design savvy and passionate about the topic, so I felt I had to speak to her more.

Source: StartupStars
DVC: Hi Suzanne, thanks for taking the time to talk about data visualization in VR.
SB: Thanks for taking the time to chat with me as well! This is a topic close to my heart, so it’s always exciting to connect with others who share the same passion.
DVC: What’s your background?
SB: I’ve been a product and UX designer for about 6 years, with a focus on data visualization and data analytics products, primarily those for the real estate industry (commercial and residential). I always had a passion for VR and also augmented reality (AR) as well.
When designing data visualization and analytics tools for the real estate industry, I had to work with very large, nationwide, and sometimes worldwide datasets. There were lots of usability challenges when developing ways to show these datasets on flat screens.
DVC: What got you into combining data visualization with VR?
SB: I had the idea that moving into VR would add a great deal of value in the sense that it would allow for a much larger amount of data to be displayed in a single view. It would also allow users to view more than one or two layers of data at a time. This was the genesis of my business, BadVR. From that point on, we’ve expanded beyond geospatial data, but this is where the idea began.
DVC: Tell me more about your company BadVR and what sets you apart from what’s currently out there?
SB: BadVR was founded in November 2017. We became operational in April 2018. I’m the CEO and Jad Meouchy is my co-founder and CTO. Our vision is to fundamentally advance how people understand and interact with their data by building new immersive standards for visualizing and analyzing datasets. We are working on building a world in which data is no longer bound by flat screens, chart axes, or dashboards; a world in which your data is as multi-dimensional and interactive as you are.
![]()
We approach solving this problem from several angles. First, we are not bound by any one platform – we use AR, VR, app stores, and webXR to deliver our data experiences. Being flexible in terms of hardware & platforms lets us remain committed to our vision of making data immersive, in whatever way best suits it. For instance, our AR standards are not VR compatible. While similar (or the same) to the public, each has very different use cases and end-user experiences. BadVR embraces both VR and AR, but to ensure the quality of the user’s experience, the visualization standards offered change, based on the platform.
Second, we believe ‘immersive data’ means more than just porting existing charts into VR or AR. Immersion to us is defined by interactivity, utilization of the entire immersive environment, and collaborative experiential analysis. Charts represent a great method of viewing data on flat screens and paper but do not best utilize the potential of immersive technology. 2D workflows just do not translate well into 3D spaces. We believe that shoehorning the standards for flat data visualization into immersive platforms is completely missing the point. Therefore, our product strategy has been focused around finding and developing these new standards for immersive data visualization and ensuring that they work with 90-95% of all modern datasets, regardless of scale.
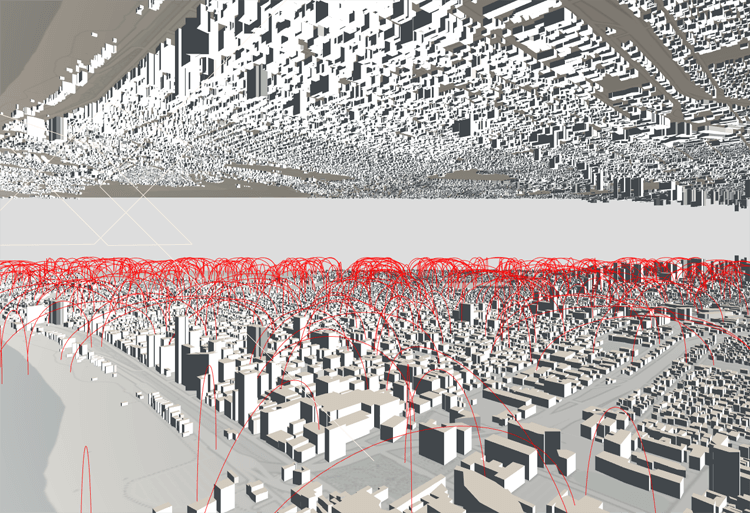
Source: BadVR – Screenshot of localhost visualization
Third, all our experiences are fully interactive within immersive environments. Most of our competitors offer static immersive charts that require exiting out of the immersive environment to adjust inputs. Our experiences allow you to filter millions of data points within seconds, on consumer grade hardware, including mobile phones.
Additionally, we have a specialized data controller that makes the experience of interacting with your data intuitively and easy. As a former UX designer, the inputs and usability of most VR and AR devices make me shudder! The idea of having to point a controller at a flat button placed in space or having to use a controller to enter search queries via a flat keyboard panel floating in space was just unacceptable. In response, I designed and built my own data controller, which we now use for all our VR data experiences.
DVC: Where do you see immersive data visualization going in future?
SB: I think it’s going to begin with datasets that lend themselves nicely to immersive environments – i.e. geospatial data. This could be real estate, or smart city data, telecom, or construction. From there, I think we’ll see it expand into contextualized manufacturing AR overlays (visualizing Internet of Things sensor data in real time, within factory environments).
After this, we’ll be able to move on to visualizing more abstract data, which is more difficult to visualize, but just as valuable to see in an immersive way. Industries that place a great deal of value on visualizing data (finance, network security, marketing) will be the first to adopt this.
From there, new standards for visualizing and presenting immersive data will emerge, and once these are acknowledged and adopted, they will become standard practice and most datasets will be presented in this manner.
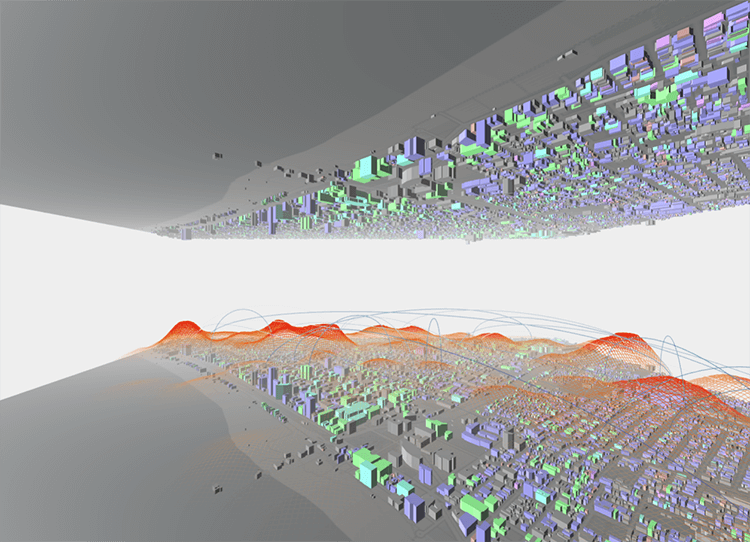
Source: BadVR – Screenshot of geospatial data visualization
As datasets become larger and more complex as time goes on, businesses will HAVE to present the data in this way, as there are many usability challenges when visualizing very large, complex datasets on flat screens. Without immersion, context is lost, layers of bias are invited, and the ability to look holistically at an entire dataset is lost. Users can only see one small piece at a time on flat screens with traditional visualizations, via summaries and/or slices.
Artificial Intelligence (AI) and machine learning (ML) will help parse through large datasets to make them more manageable, but it will take these technologies a very long time to be able to perform the type of abstract analysis humans are capable of performing, let alone with the level of speed and quality which we can perform them. Hence, humans will want a tool by which to perform this analysis ourselves.
We will also need a tool to monitor AI & ML models to ensure that their performance stays on track. Immersive data visualization is this tool – a way for humans to see and interact with very large complex datasets in a holistic way. I believe it will work in concert with AI & ML to help find actionable value and meaning in large, modern datasets.
DVC: Do you think new and unique forms of data visualization will emerge out of VR?
SB: I know new forms of data visualization will emerge out of VR – I’ve spent the last few years of my life developing them! : )
These new standards are necessary to capture the full potential of immersive data, and until they are deployed, people will continue to be skeptical about immersive data visualization. The idea of an immersive scatter plot or line graph isn’t compelling enough for most users.
Plus, VR charts do not add enough value – why not just make a 3D chart in Excel? Why not just look at a 3D chart on a flat screen? Where’s the value of putting data into VR if it’s just a 3D chart? Until such arguments are overcome with brand new, compelling, creative, and ultimately more valuable VR data visualization standards, the public will not really take the concept seriously.
Product strategy within this space matters greatly; it’s the make or break between VR being some that adds value or simply a gimmick. There are a lot of interesting ways that VR can add value to data visualization and data analytics, but until we fully utilize all that VR can offer, the concept will cease to gain traction.
As a product designer, I had to really let go of all my preconceived notions and 2D best practices for data visualization to be able to conceptualize, design, and help build these new standards. My belief is that they are indeed compelling – and valuable — enough to transform data visualization into the killer app for VR! : )

