How long will it take me by car to get out of the city? Where’s a good part of town to move to that is a reasonable travel time to work? What parts of the country are well-connected and won’t take a long time to travel to?
All of these kinds of questions can be answered through the use of Isochrone Maps, also known as “travel time maps”, as they visualise the journey time from a particular location or in some cases, multiple locations.
Isochrone Maps work by colour-coding areas on a map based on the time it takes to arrive at those areas from a start point. So for example, if it takes 1 hour to travel any positions on a map then all those areas on the map will be one colour. Any other durations (for example 2 hours) would be assigned another colour and there would be an entire colour scale based on each significant duration (1 hour, 2 hours, 3 hours, etc).
This makes Isochrone Maps particularly useful in travel planning as they reveal what places are accessible within a set time period. Isochrone Maps are also useful for showing how well-connected the transport networks are in a particular geographical region.
While it may seem like a recent invention, Isochrone Maps have actually been around for a relatively long time. The first known Isochrone Map, Isochronic Passage Chart for Travellers was published in 1881 for the Proceedings of the Royal Geographical Society:

Source: Wikipedia
This map was designed by Francis Galton to show the travel times in 1881 from London to different parts of the World in terms of the number of days it would take.
The next year in 1882, E. Martin produced an exquisite Isochrone Map displaying the travel times from Paris to the rest of France (Carte des communications rapides entre Paris et le reste de la France).
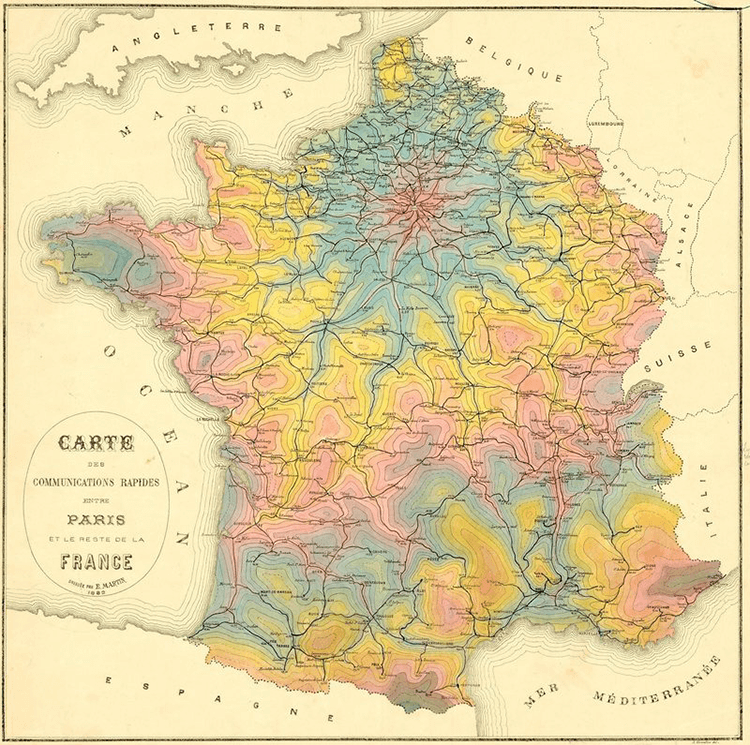
Source: University of Chicago Map Collection/Public Domain
Later in 1889, John G. Bartholomew published in An Atlas of Commerical Geography his own version of an Isochrone World Map. Titled Isochronic Distance Map of the World, this map also visualises the journey times from London to other parts of the World but is superimposed onto an equal-area Mollweide projection.
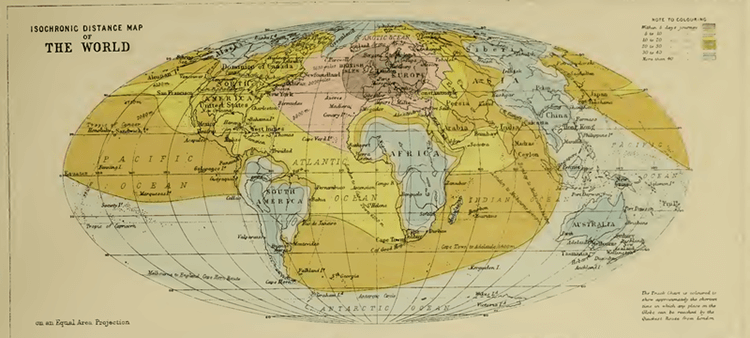
Source: J.G. Bartholomew’s 1889 “Atlas of Commercial Geography”, Archive.org
In 1914, Bartholomew produced an updated Isochronic Distances map, similar to Galton’s format in 1881 and with a more vibrant colour palette:
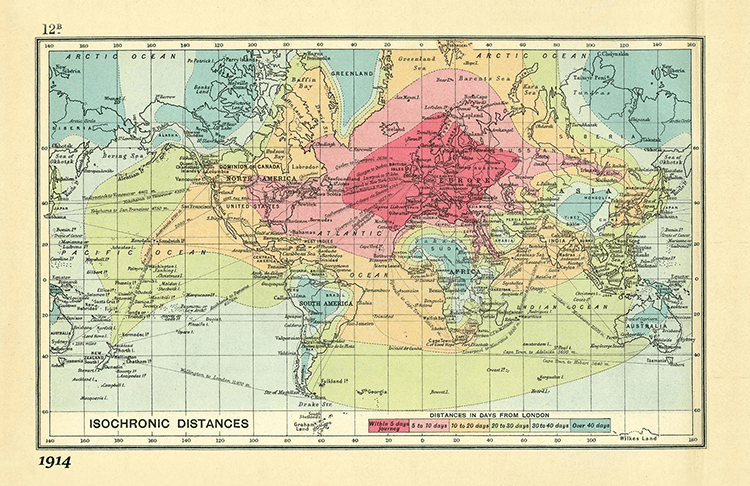
Source: Travel Times From London in 2016 vs 1914, Brilliant Maps
The team at Rome2rio took inspiration from this map and created their own updated version of it for 2016:
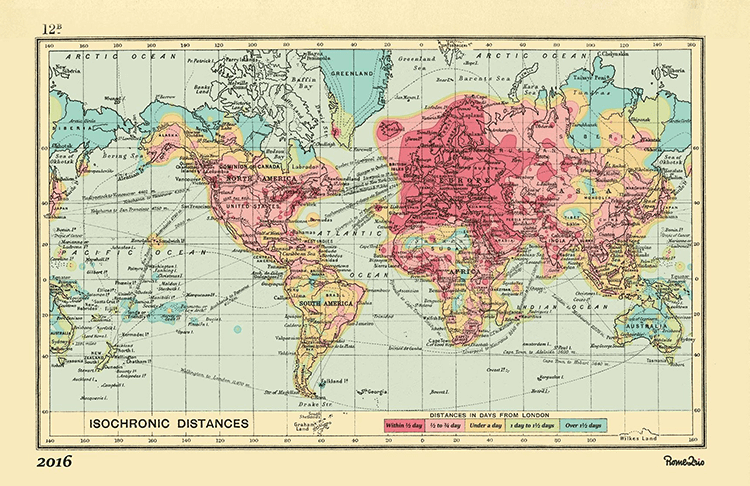
Source: Time flies? According to these maps it does, Rome2rio
You can see from this updated map that travel times across the World have immensely, as advancements in transportation technology and industry have developed.
Returning to earlier Isochrone Maps, Wilhelm Schjerning in 1903 created his own unique Isochrone Map for the province of Brandenburg for the year 1819. Here, Schjerning has grouped and colour-coded different travel time ranges so that the map is divided into 4 zones that are determined by their travel time.
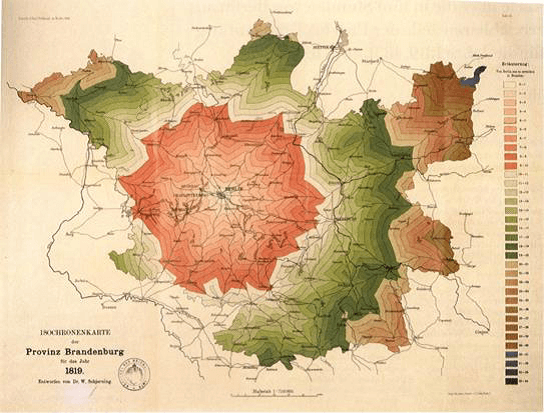
Source: Isochrone map of Berlin 1819, 1906 and 2015, Alternative Transport
The Melbourne and Metropolitan Tramways Board sometime between 1910 and 1922 applied the use of Isochrone Maps for the transport network of the city of Melbourne. It’s not clear who exactly designed the map below, but I like the bubble-like approach of this map’s design.

Source: Wikipedia
Development in information technology has to lead to a renaissance of Isochrone Maps as software can now automate the drawing these types of visualisation. Also now Isochrone Maps can be made interactive and connected to the internet, which allows for the development of handy Apps and tools.
One such example of an Isochrone Map App is UK-based Mapumental, which works by combining Ordnance Survey postcode data with public transport timetables, then displays the results using Leaflet on OpenStreetMap.
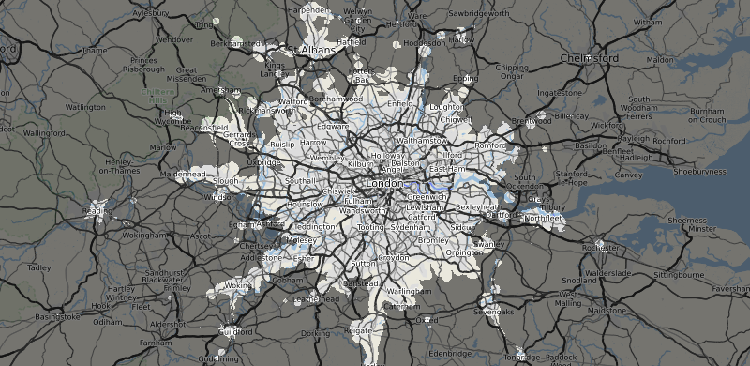
Source: mapumental.com
Recommended further reading:
- Travel-time Maps and their Uses, mySociety.org
- First Mapumental-powered property travel time maps go live, mySociety.org
While Mapumental only works in the UK, TravelTime Maps works in a number of different countries and can calculate the journey times for five different modes of transport (cycling, driving, public transport, walking, and driving & train).
Source: TravelTime Platform
Another App is Mapnificent, which was originally inspired by mySociety’s Mapumental. Because of this, you can see similarities in the design, however, Mapnificent isn’t limited to the UK and is available in a wide range of different cities.
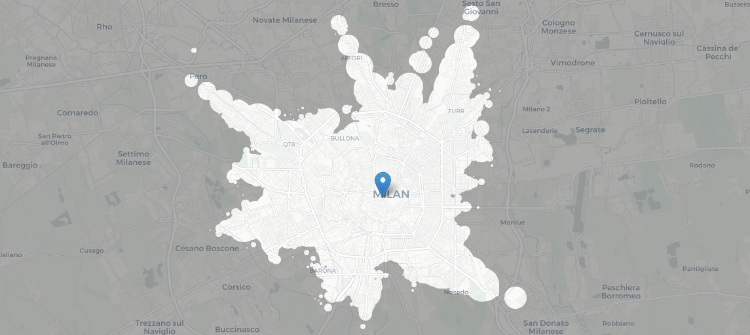
Source: Mapnificent.net
ISO4APP is a platform that allows you to create your own Isochrone Map. If you check out their demo, you can see that this tool has a lot more options to customise the map with. There’s even the capability to see a street distance view that colours the streets instead of using a polygon area.
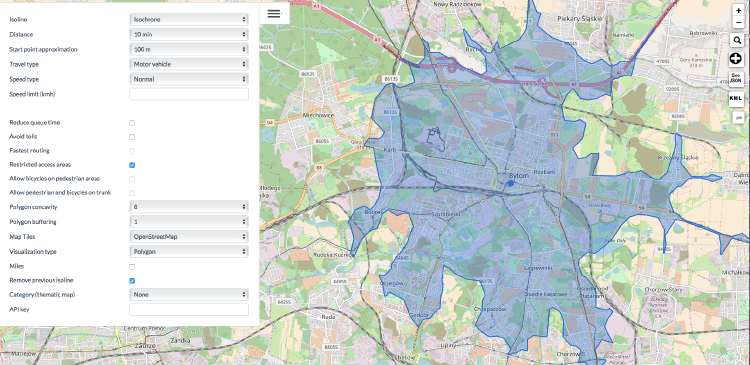
Source: ISO4APP
Next Isochrone Map App I’ve discovered is from Mapbox. Here, instead of using solid polygon areas, this visualisation uses more of a Heatmap effect that blends all the travel time zone areas into a continuous colour scale:
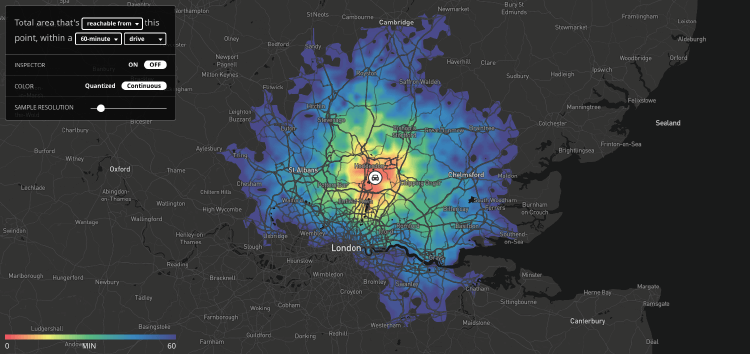
Source: mapbox.com
However, if you select Quantized under COLOR from the menu, you get a more typical Isochrone Map design with the travel time zone areas with outlined polygons:
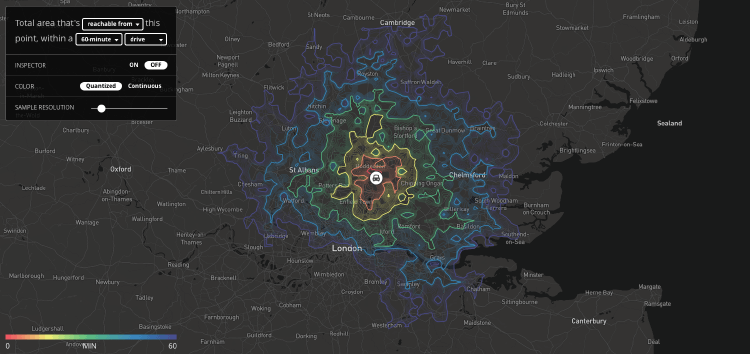
Source: mapbox.com
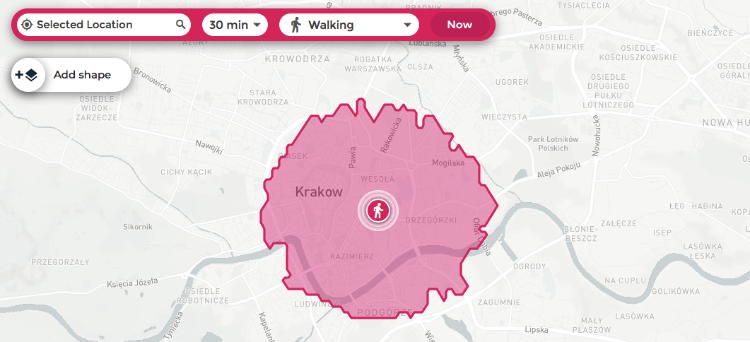
Targomo has an Isochrone Map App that they have developed on their platform, which visualises a series of ‘blobby’ rings for each travel time zone:
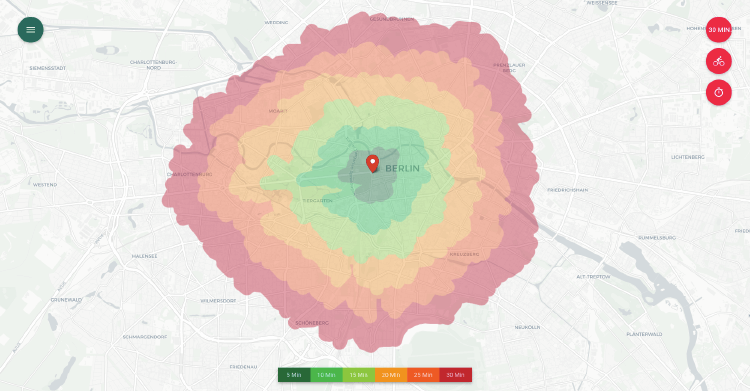
Source: Targomo
Moving on from App platforms, let’s now look at some contemporary examples of Isochrone Maps and explore some more different design variations.
Vincent Meertens wanted to illustrate how due to a good public transport system, distance had become irrelevant in the Netherlands and people instead think of how long it will take them to reach somewhere in the country. Meertens’ response was to develop an interactive visualisation that morphs the map according to the origin city. By sacrificing geographical accuracy, Meertens’ Isochrone Map lets you know how close a city or town is in travelling time. This eliminates the illusion that somewhere may take less time to reach, just because geographically it is closer.
Another map similar to this is from the work of the veteran Japanese graphic designer Kohei Sugiura, who in his book compiling his stunning design work, featured his own experimental time distance map. Originally, this map was designed for an issue of the magazine Shukan Asahi and the data was taken from the 1969 issue of the Japanese national railway timetables. Like Meertens’ map, Sugiura designed a map that distorts the original geographical map accordingly to the travel times.
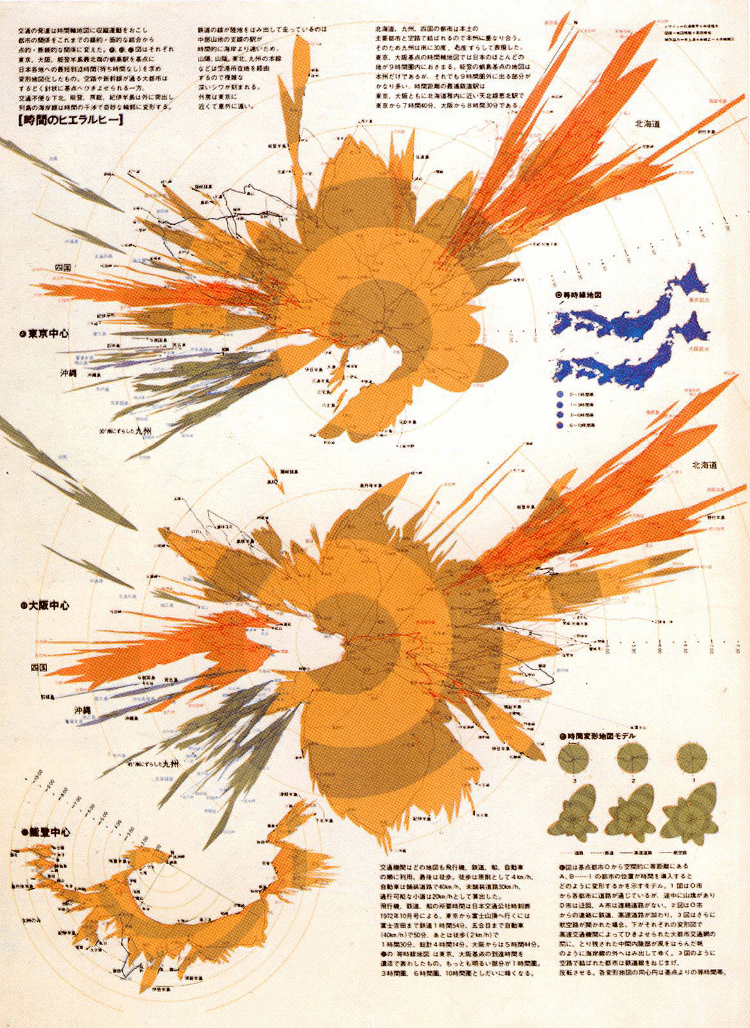
Source: Experiments in “Time Distance Map”: Diagram Collection, Kohei Sugiura
Recommended further reading:
- The Glorious Data Visualisations of Kohei Sugiura, PaperPosts
- Japan Travel-Time Map, Visual Complexity
Not all Isochrone Maps visualise the travel times from a single start point. The Malaria Atlas Project (University of Oxford) in collaboration with researchers at Google, the Joint Research Centre of the European Union, and the University of Twente (Netherlands) created a global map of accessibility to cities for the year 2015. This map of the World displays the travel times across all towns and cities to illustrate the disparities in accessibility to urban areas. The colour scale on the map ranges from minutes (in yellow) to nearly a week (dark purple) to hammer in this point.
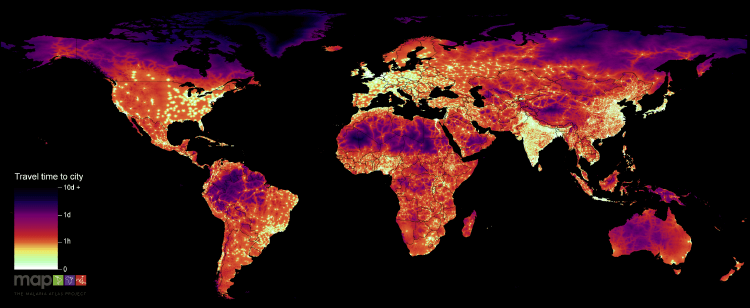
Source: The Malaria Atlas Project
Recommended further reading:
- The daily commute: travel times to cities around the world – mapped, The Guardian
- Maps that show travel times to cities all across the globe, Phys.org
Somebody has actually created a chart that displays small multiple Isochrone Maps. Topi Tjukanov from Finland has visualised how far you can travel by car from the centre of 20 different European cities. By display all the cities together, you can see the different patterns that emerge from each of them and compare them to one another. Check out this podcast episode from Data Viz Today discussing this project in more detail.
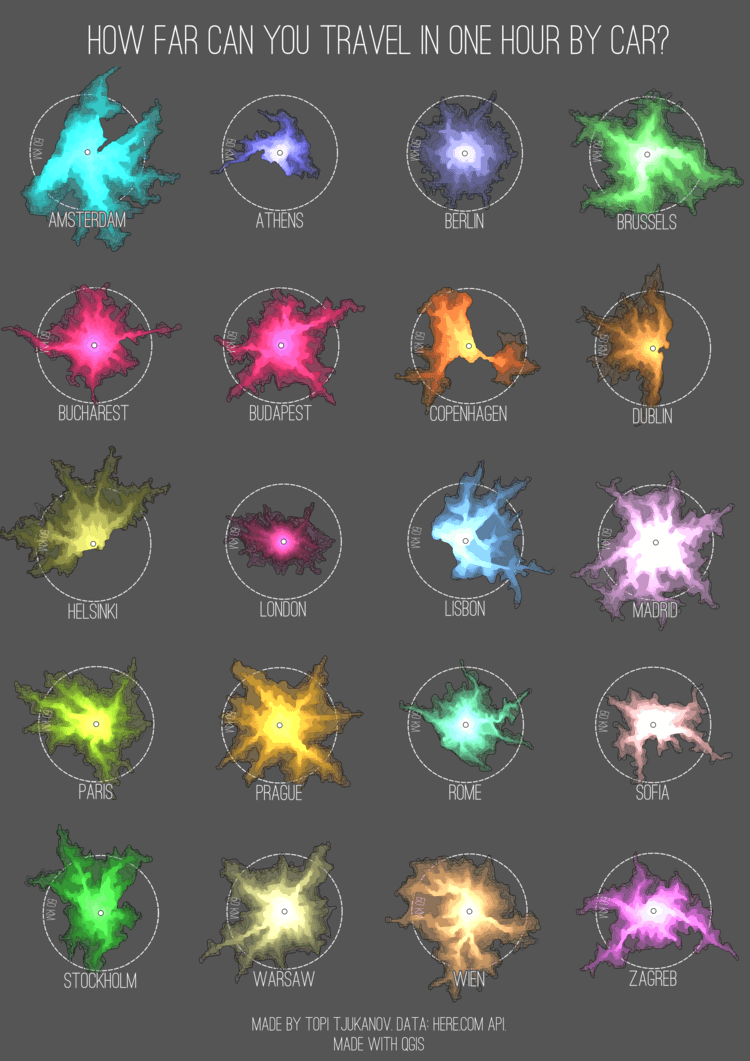
Source: Urban Forms, tjukanov.org
Let’s now take a look at animated Isochrone Maps. The first project I would like to show is Road Trees, which visualises the diffusion from the location of interest to any other point of the country’s road network. The creators’ of this project were pleasantly surprised to find that their code for generating the Isochrone Map produced beautiful fractal patterns, as you can see in the example below for Czechia.
Animated Isochrone Maps that show the changes in travelling times over each hour of the day are dubbed as ‘heartbeat’ Isochrone Maps. You can see why from this example below from Esri UK, which shows a pattern of the blue area beating in and out.
Source: Isochrone Maps 2017 in Review, Alternative Transport
Although, this type of Isochrone Map doesn’t always have to visualise the entire day and can be set within a just certain time period. Like in this piece from The Washington Post titled Here’s where D.C. public transit can take you — and who gets left behind, which looks at commute times and how late-night schedules changes could have an impact on poorer neighbourhoods.
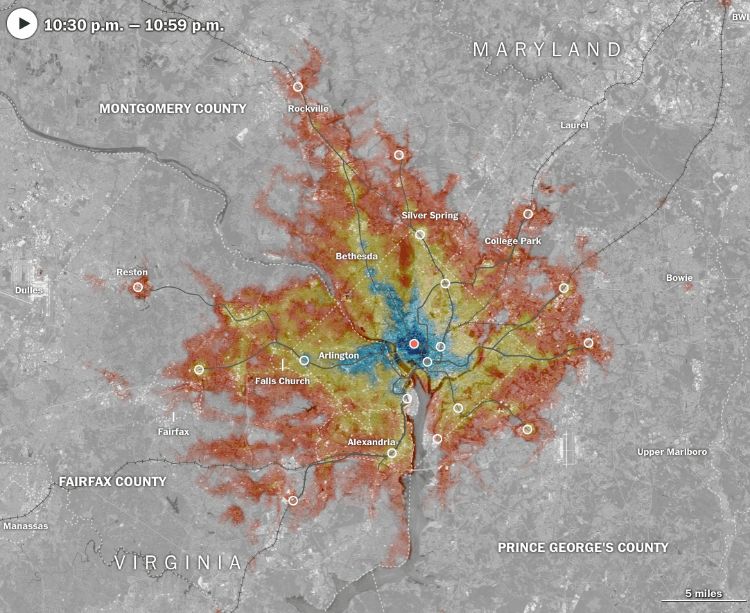
Source: Here’s where D.C. public transit can take you — and who gets left behind, The Washington Post
Moving back to static maps, one particularly interesting example I found online was this Isochrone Map of Vienna that I found on this blog post.
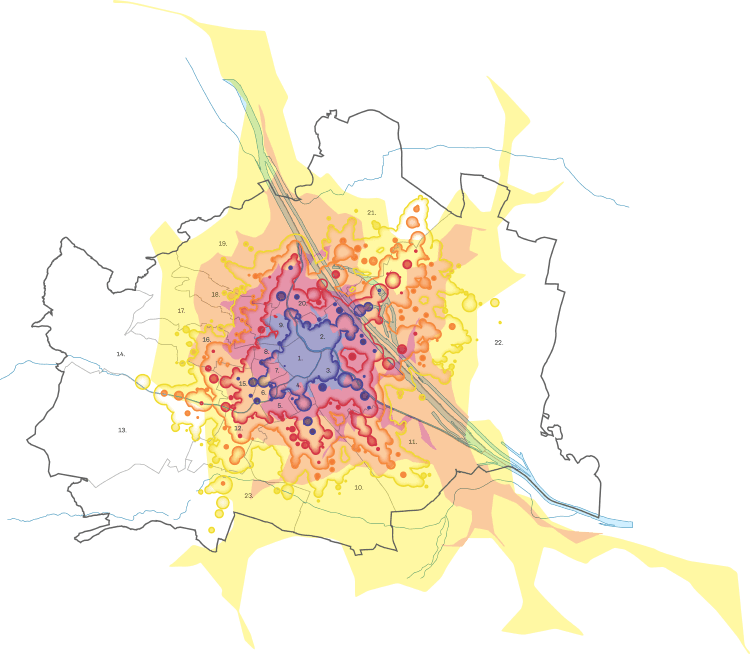
Source: How fast out of Vienna? Wie schnell aus Wien heraus?
Sticking to that part of Europe, here’s a nice Isochrone Map for the Austro-Hungarian Empire Railway Network in 1912.
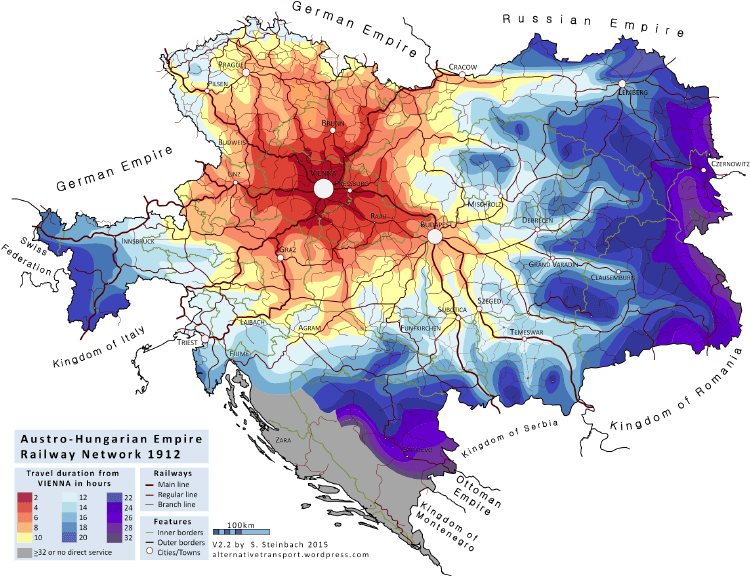
Source: Isochrone Map: Austro-Hungarian Empire Railway Network 1912 in English, Alternative Transport
While searching for the most optimal place to live in Helsinki, Finland, Lauri Vanhala constructed a visualisation by calculating the travel time from every address to every other address in Helsinki around the time 7:30 to 8:00am. Vanhala then calculated the (weighted) average travel time to anywhere in the city using the number of jobs in the target area as a weight. You can explore the visualisation Helsinkiläisen Parhaat Asuinpaikat here.
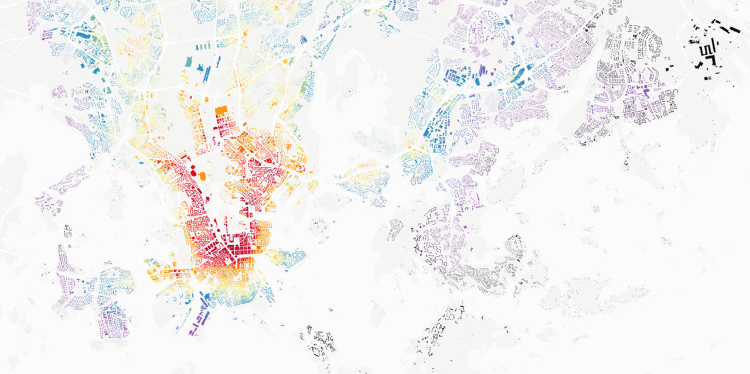
Source: Figuring out the best place to live in Helsinki, Lauri Vanhala
Another interesting street-based Isochrone Map I found from Geoff Boeing in his blog post: Isochrone Maps with OSMnx + Python.
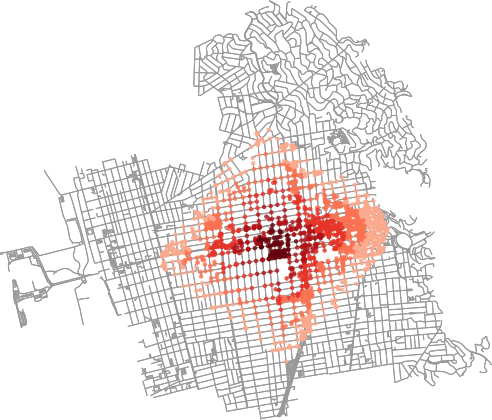
Source: geoffboeing.com
I’ve tried to be as thorough in my research without writing a blog post that’s too long. So I’ve left out some nice maps I discovered. But if you have any interesting variations of an Isochrone Map that you want to share, then you can post it in the comments section below.

