 Page top
 Previous
 Homepage
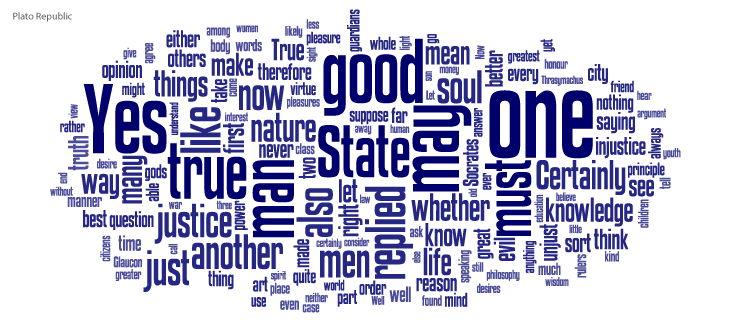
Word Cloud
Description
Also known as aTag Cloud.
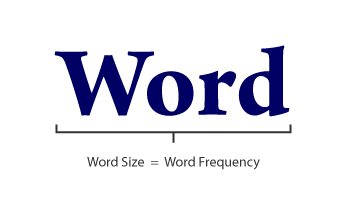
A visualisation method that displays how frequently words appear in a given body of text, by making the size of each word proportional to its frequency. All the words are then arranged in a cluster or cloud of words. Alternatively, the words can also be arranged in any format: horizontal lines, columns or within a shape.
Word Clouds can also be used to display words that have meta-data assigned to them. For example, in a Word Cloud of all the World's countries, the population could be assigned to each country's name to determine its size.
Colour used on Word Clouds is usually meaningless and is primarily aesthetic, but it can be used to categorise words or to display another data variable.
Typically, Word Clouds are used on websites or blogs to depict keyword or tag usage. Word Clouds can also be used to compare two different bodies of text together.
Although simple and easy to understand, Word Clouds have some major flaws:
Long words are emphasised over short words.
Words whose letters contain many ascenders and descenders may receive more attention.
They're not great for analytical accuracy, so used more for aesthetic reasons instead.
Functions
Anatomy
Similar Charts
...Tools to Generate Visualisation
Code-based:
amCharts (JS)
AnyChart (JS)
D3.js Graph Gallery (D3.js)
Python Graph Gallery (Python: wordcloud)
R Graph Gallery (R: Wordcloud, Wordcloud2)
Vega
ZingChart (JS)
Webapp:
Columns.ai
Creative Fabrica
Flourish
Infogram
jasondavies.com
Visage
Vizzlo
wordclouds.com
Wordcloud.pro
Desktop App:
Tableau

