 Page top
 Previous
 Homepage
 Next
Next
Radial Bar Chart
Description
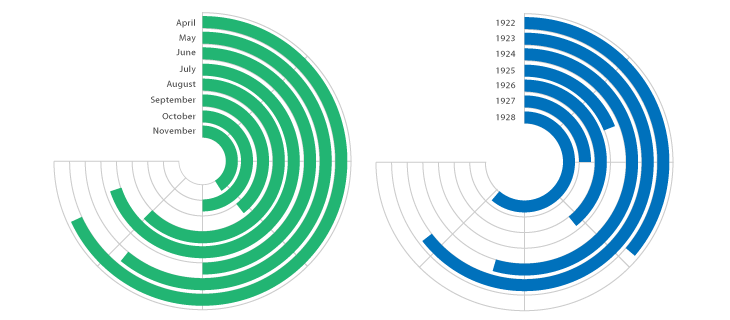
A Radial Bar Chart is essentially a Bar Chart plotted on a polar coordinates system, rather than on a Cartesian one.
The problem with Radial Bar Charts is that the bar lengths can be misleading. Each bar on the outside gets relatively longer than the previous bar, even if they represent the same value. This is because each bar is at a different radii.
Since our visual systems are better at interpreting straight lines, a regular Bar Chart is a better choice for comparing values. The main reason to use a Radial Bar Chart instead is aesthetic.
Functions
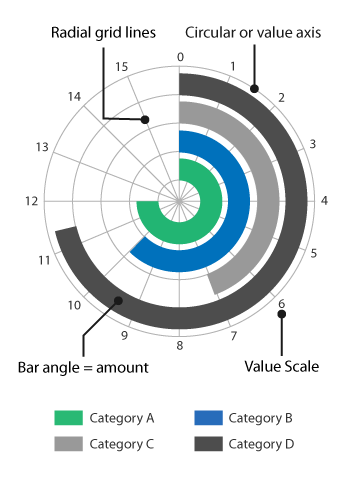
Anatomy


Tools to Generate Visualisation
Code-based:
amCharts (JS)
AnyChart (JS)
Apache ECharts (JS)
JSCharting (JS)
Webapp:
Everviz
Infogram
Vizzlo

