 Page top
 Previous
 Homepage
 Next
Next
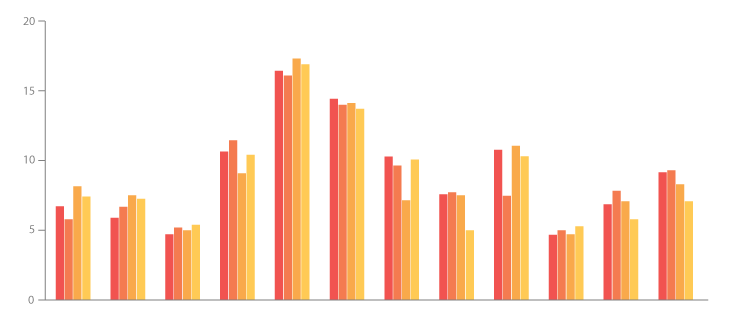
Multi-set Bar Chart
Description
Also known as a Grouped Bar Chart or Clustered Bar Chart.
This variation of a Bar Chart can be used when two or more data series need to be plotted all on the same axis and grouped into parent categories.
Like on a Bar Chart, the length of each bar on a Multiset Bar Chart is used to show discrete, numerical comparisons amongst categories. Each bar for a data series is assigned a colour to distinguish them apart. Bars in the same group are placed together and are then spaced apart from other bar groupings.
The use of Multiset Bar Charts is usually to compare across categories that contain the same sub-categorical variables between them. Each bar is a subcategory that is grouped into a larger parent category.
Multiset Bar Charts can also be used to compare mini Histograms to each other, so each bar in the group would represent the significant intervals of a variable. Another use could be to use Multiset Bar Charts to show data changing over time by having, for example, each bar represent a point in time such as a year.
The downside of Multiset Bar Charts is that they become harder to read the more bars you have in one group. Therefore, you should try to limit the number of bars per group.
Functions
Anatomy


Tools to Generate Visualisation
Code-based:
amCharts (JS)
AnyChart (JS)
Chart.js (JS)
D3.js Graph Gallery (D3.js)
FusionCharts (JS)
Google Charts (HTML5)
Highcharts (JS)
JSCharting (JS)
Mike Bostock’s Block (D3.js)
NVD3.js (D3.js)
Plotly (JS)
Python Graph Gallery (matplotlib)
R Graph Gallery (R, ggplot2)
Vega
Vega-Lite
ZingChart (JS)
ZoomCharts (JS + HTML5)
Webapp:
Datavisual
Datawrapper
Datylon
Flourish
Google Docs
Infogram
plotDB
RAWGraphs
Slemma
Vizzlo
Desktop App:
Adobe Illustrator
Apple Numbers, Keynote, Pages
Microsoft Office, PowerBI
Tableau

