 Page top
 Previous
 Homepage
 Next
Next
Donut Chart
Description
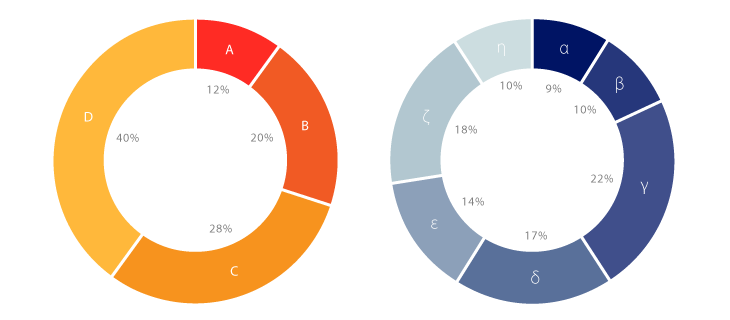
A Donut Chart is essentially a Pie Chart but with the area of the centre cut out.
However, Donut Charts have a slight advantage over Pie Charts, which are sometimes criticised for focusing on the relative sizes of the pieces to one another and to the chart as a whole, giving no indication of changes as a whole when compared to other Pie Charts.
A Donut Chart partly addresses this problem by de-emphasising the use of area, to make the viewer focus more on the changes in overall values. You are focused on reading the length of the arcs, rather than comparing the proportions between slices.
Also, Donut Charts are more space-efficient than Pie Charts because the blank space inside a Donut Chart can be used to display information inside it.
Functions
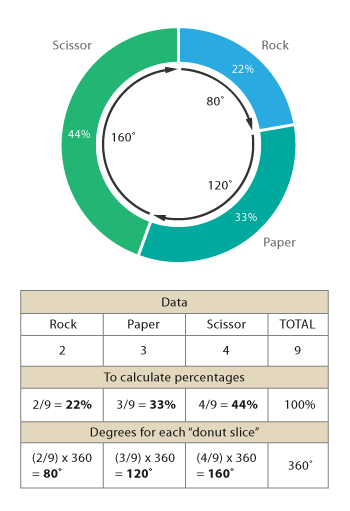
Anatomy


Tools to Generate Visualisation
Code-based:
AnyChart (JS)
Chart.js (JS)
D3.js Graph Gallery (D3.js)
Google Charts (HTML5)
JSCharting (JS)
Mike Bostock’s Block (D3.js)
Plotly (JS)
Python Graph Gallery (matplotlib)
R Graph Gallery (R + ggplot2)
Vega
Vega-Lite
ZingChart (JS)
ZoomCharts (JS)
Webapp:
Datamatic
Datavisual
Datawrapper
Datylon
Flourish
Google Docs
Infogram
Slemma
Vizzlo
Desktop App:
Adobe Illustrator
Apple: Numbers, Pages, Keynote
Microsoft Office, PowerBI
Tableau

