A Non-contiguous Cartogram is a type of Cartogram where the geographic regions (such as countries, states, etc.) are resized based on a numerical variable (e.g. population, GDP, etc.), but their shapes are preserved. Also, the region boundaries are not connected or contiguous with their neighbouring regions.
In a Non-contiguous Cartogram, each geographic region is scaled in proportion to the data value being represented, but the scaled areas are not constrained to fit together like a jigsaw puzzle. Instead, the resized regions are separate, allowing for gaps between them. This preserves the original shape of each region, unlike in contiguous Cartograms where the regional shapes are heavily distorted.
The downside to Non-contiguous Cartograms is that the scattered layout can sometimes appear chaotic. Since the spatial continuity is broken, this can make it difficult to perceive the overall shape of the entire region being mapped. Also, smaller areas may need to be moved to avoid overlapping with larger neighbouring regions.
Tools to generate this chart with:
ArcGIS
D3.js
QGIS
R
Examples
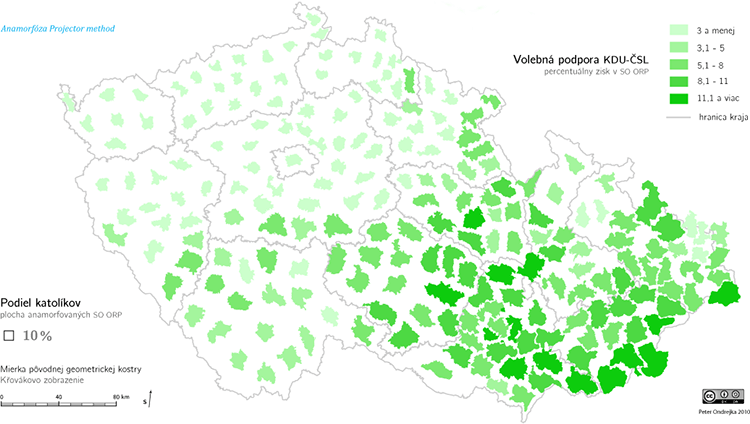
Non-contiguous isomorphic cartogram of the Czech Republic, in which the size of each district is proportional to the Catholic percentage and the color (choropleth) representing the proportion voting for the KDU-CSL party in 2010, showing a strong correlation.
Czech parliamentary elections 2010 — Peter Ondrejka 2010 / Wikipedia
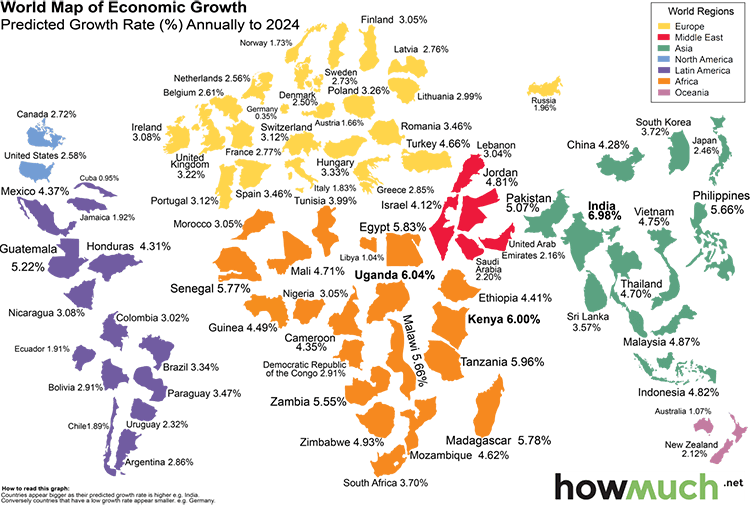
World Map of Economic Growth, Predicted Growth Rate (%) Annually to 2024.
This World Map Shows the Economic Growth Over the Coming Decade — howmuch.net
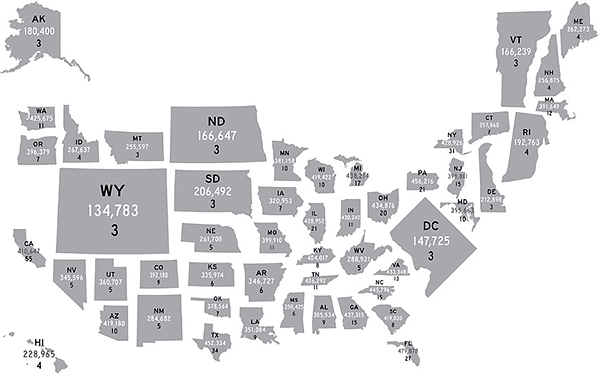
Op-Chart: How Much Is Your Vote Worth?
The New York Times
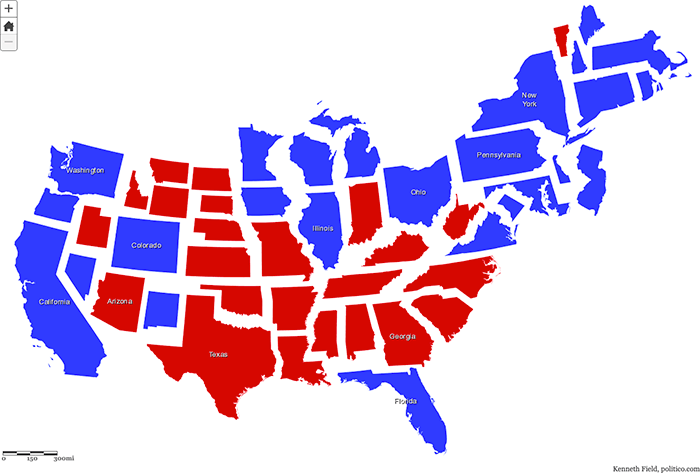
2012 US Presidential election results by State.
Non Contiguous Cartogram — Kenneth Field / ArcGIS
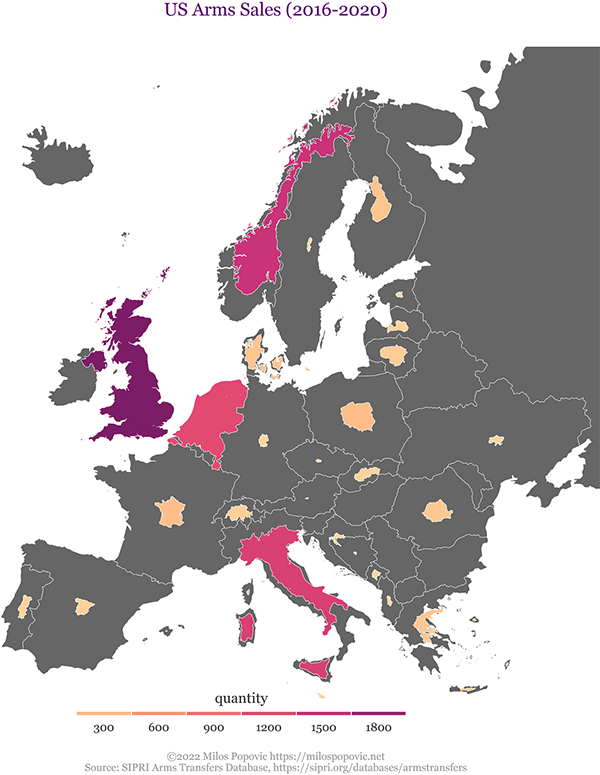
US Arms Sales (2016-2020).
Web scrapping SIPRI arms data using search request with R — Milos Popovic
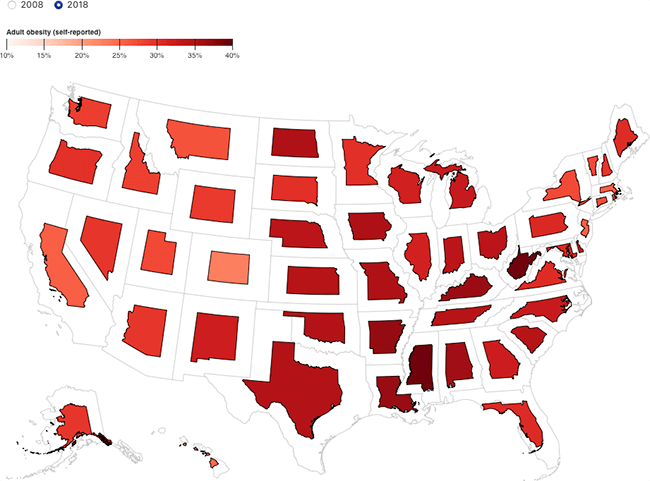
Adult obesity (self-reported) 2018.
Non-contiguous cartogram — Mike Bostock / Observable
Related posts:
Chart Snapshot: Cartograms
Further Exploration #6 Cartograms
