Also known as Tilegram, Hexmap Cartogram.
A Hex Cartogram is a variation of the Mosaic Cartogram that uses hexagonal tiles instead of squares to make up the geographical regions. In a Hex Cartogram, each hexagonal tile represents a nominal unit from a particular variable (e.g. 1 hexagon = 1 million people). Hence, the number of hexagonal tiles assigned to a region is proportional to the data value assigned to that region.
Colours can be assigned to the hexagonal tiles in a Hex Cartogram to distinguish geographical regions, represent categories, or visualise an additional numerical variable.
The hexagonal tiles in a Hex Cartogram are arranged to give a rough approximation of the original shape and relative position of the geographical regions while preserving recognisable features like peninsulas or islands to aid recognition.
Tools that can generate Hex Cartograms:
Arcgis
d3-hexjson (D3.js)
Flourish
HexJSON HTMLWidget for R
Open Innovations (has a list of different solutions)
ONSgeo/HexMapping (Python)
TILEGRAMS by Pitch Interactive
Examples of Hex Cartograms
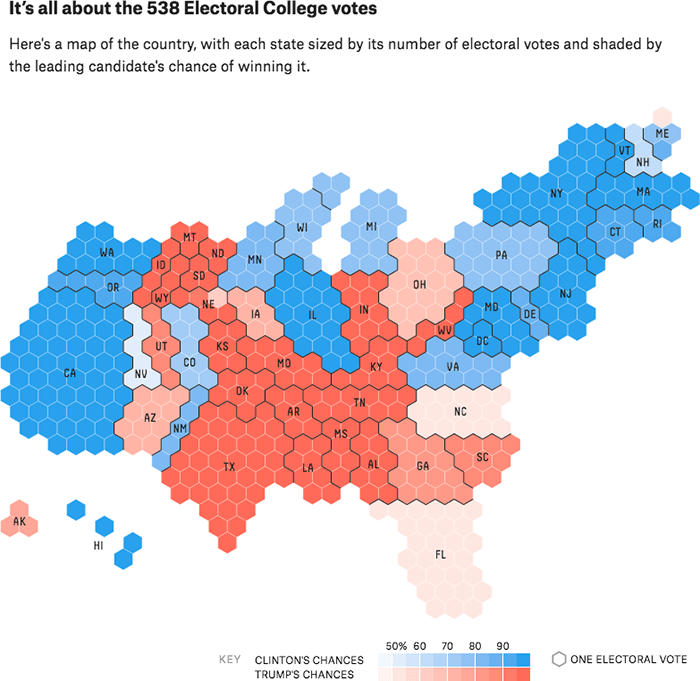
It’s all about the 538 Electoral College votes.
Cartogram — Purpplesale / Sivaram Parameswaran
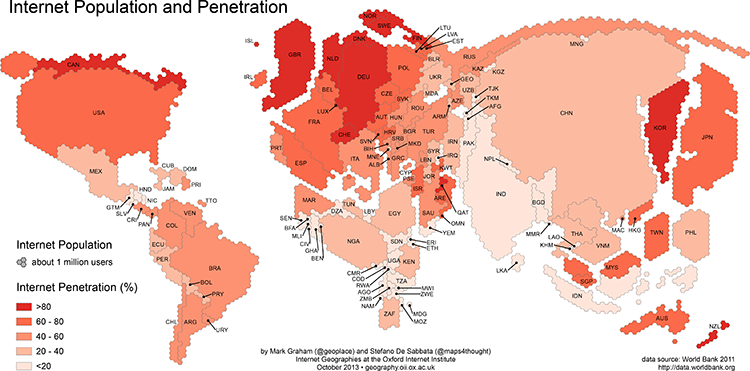
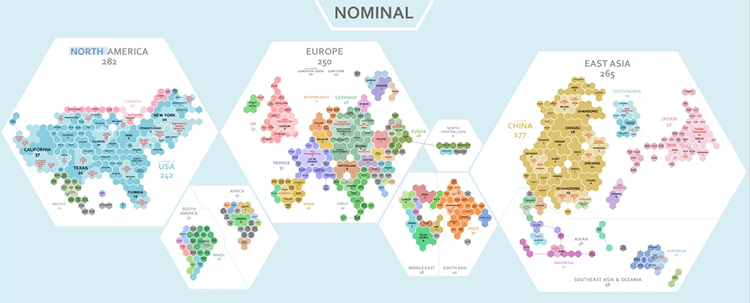
Internet Population and Penetration.
Information Geographies — Oxford Internet Institute / University of Oxford
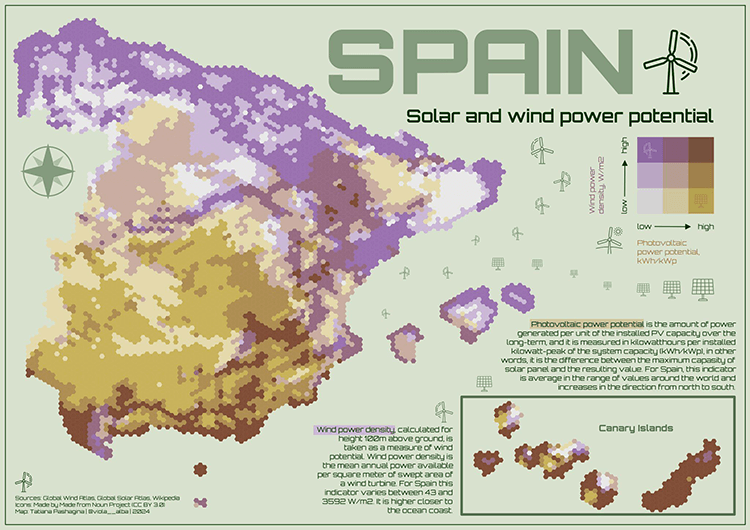
SPAIN, Solar and wind power potential.
Tatiana Pashagina
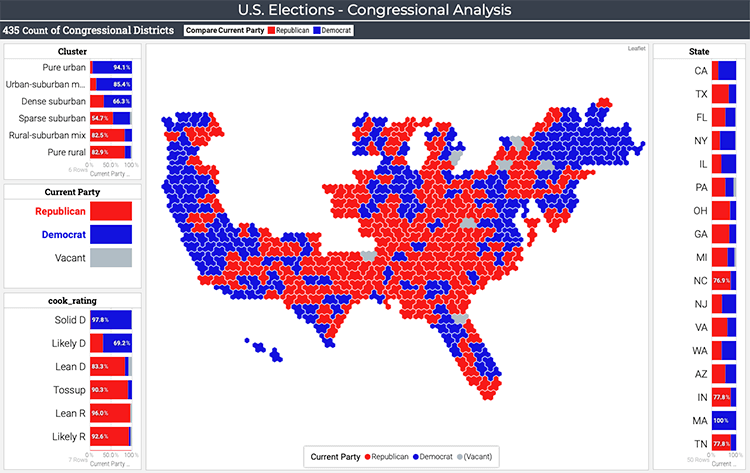
U.S. Elections – Congressional Analysis.
Keshif
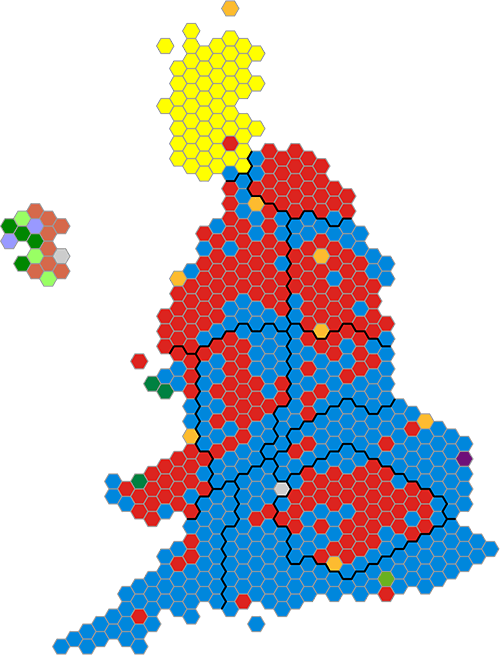
2015 UK general election constituency map.
Wikipedia
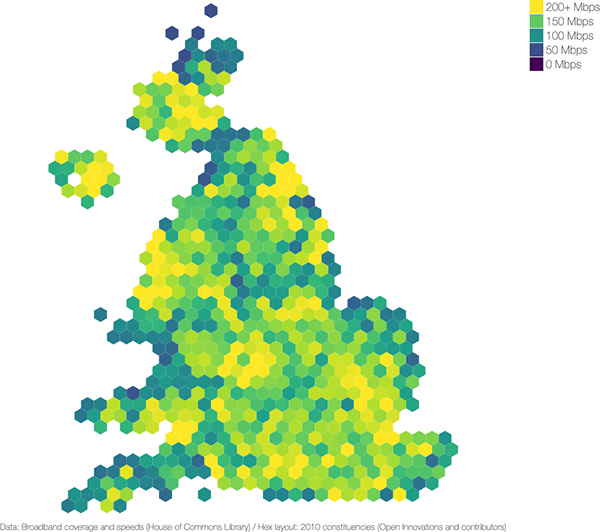
Average download speeds (January 2024).
Broadband (UK) — UK Constituency Data
If there were only 1000 GDP in the world, where would they be?
r/MapPorn / Reddit
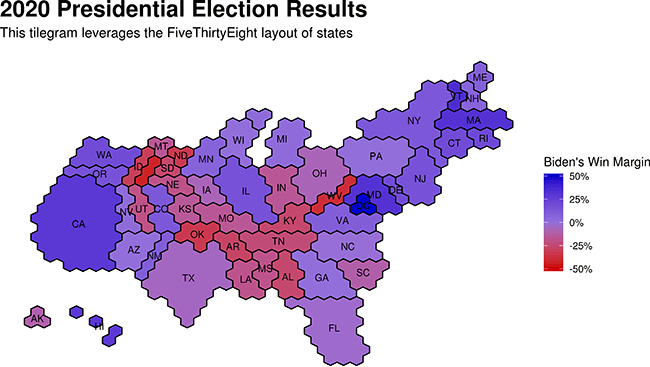
2020 Presidential Election Results.
Building Better State-Level Election Maps with Cartograms and Tilegrams — Conor McLaughlin
Related posts:
Further Exploration #6 Cartograms
Chart Snapshot: Mosaic Cartograms
