Also known as a Dot Plot, Dot Graph, Dot Chart.
A Cleveland Dot Plot is a simple form of data visualisation that plots dots to compare the values of a one-dimensional variable across multiple categories. On a Cleveland Dot Plot, one axis will list the categories, while the other axis represents a discrete value scale.
A Cleveland Dot Plot serves as an alternative to a Bar Chart and offers a some advantages such as: reduced visual clutter, no need to start from zero, easier value comparison and pattern identification.
These plots are particularly effective for displaying smaller datasets with a moderate number of categories.
Tools that can create a Cleveland Dot Plot:
Datawrapper
Datylon
Flourish
plotly (Python)
ggplot2 / R
R w/ dotchart
Vega-Lite
Vizzlo
Examples of Cleveland Dot Plots
Dot Plot, Make Vs Avg. Mileage.
Top 50 ggplot2 Visualizations – The Master List (With Full R Code) — r-statistics.co by Selva Prabhakaran
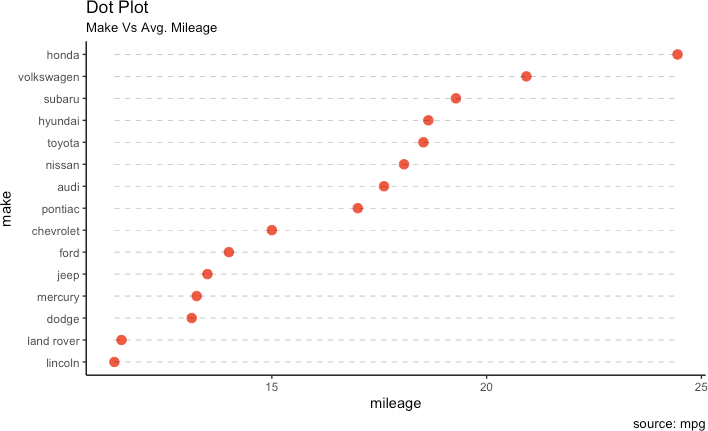
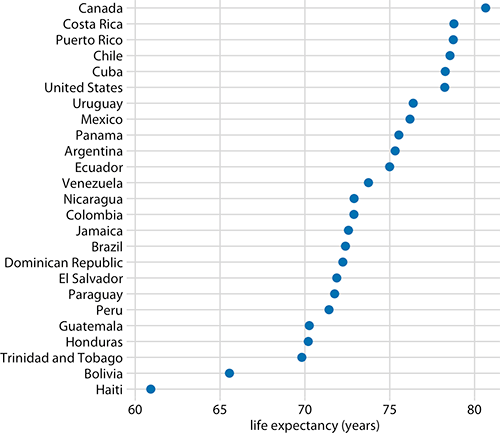
Figure 6.11: Life expectancies of countries in the Americas, for the year 2007.
Visualizing amounts, 6.3 Dot plots and heatmaps — Fundamentals of Data Visualization, Claus O. Wilke
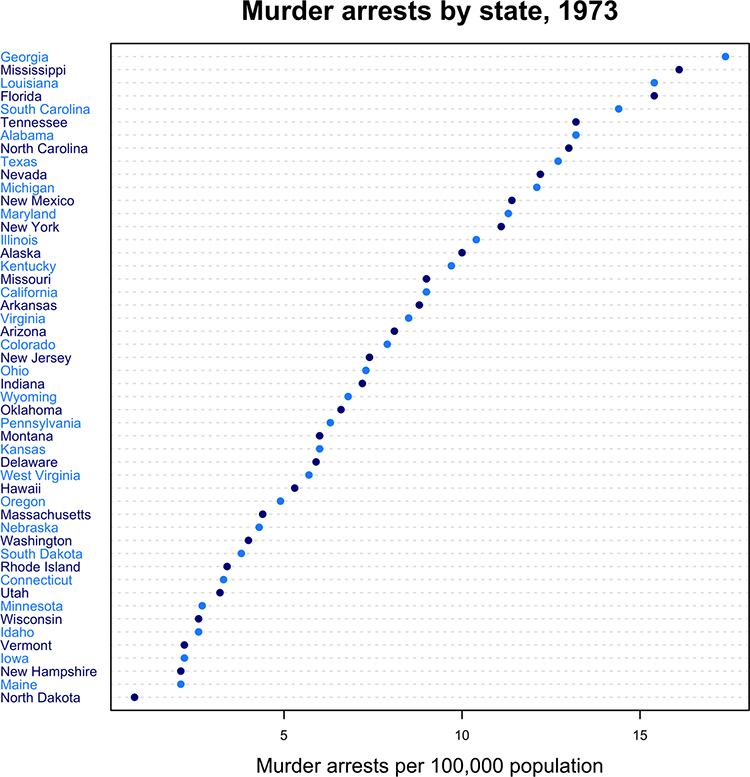
Murder arrests by state, 1973.
Chapter 4. Dot Charts, Graphing Data with R by John Jay Hilfiger
What sort of people would party members want to see more of in the Commons.
Datawrapper

Mobile phones seen as better for individual users than society as a whole.
Majorities say mobile phones are good for society, even amid concerns about their impact on children — Pew Research Center

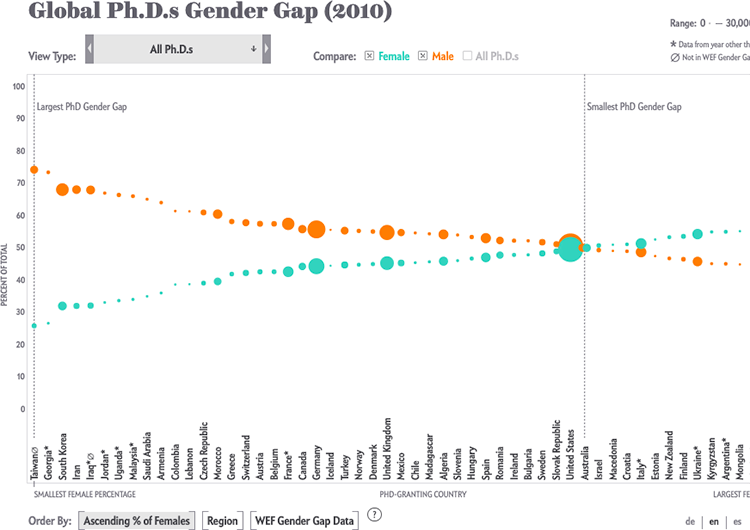
Global Ph.D.s Gender Gap (2010).
How Nations Fare in PhDs by Sex [Interactive] — Scientific American
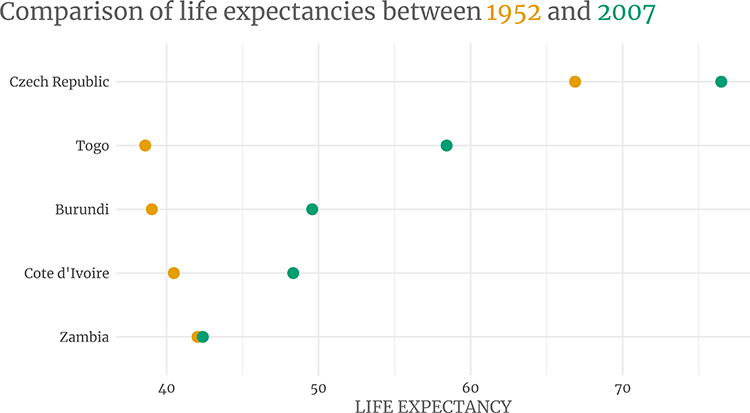
Comparison of life expectancies between 1952 and 2007.
Alternatives to paired bar charts — Albert Rapp
Related posts:
Chart Snapshot: Counts Plots
Chart Snapshot: Dumbbell Plots
