Also known as a Radial Dendrogram.
A Circular Dendrogram is a variation of a Dendrogram that visualises the structure of hierarchical clustering on a polar (radial) layout. This chart helps to display and classify the taxonomic relationships between entities related to a group.
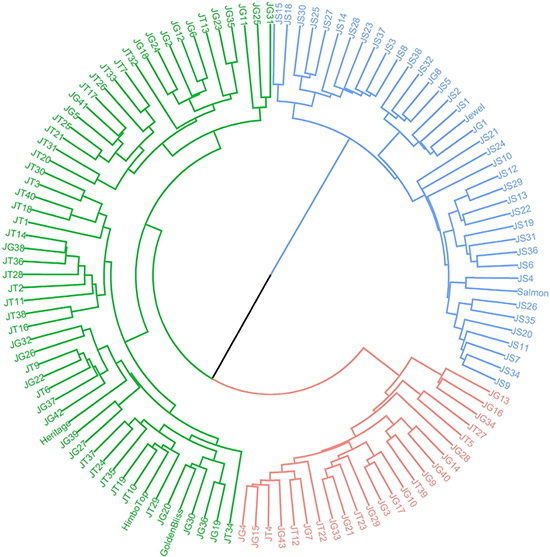
Circular Dendrograms are constructed of branches called clades. These branches are divided into smaller branches, with each end in a point called a leaf, which represents an individual entity. Clades closer to the edges of the diagram show individual entities, while the more central clades represent groups of entities clustered together. Clades that contain only a single leaf represent the outliers, which are the entities that do not cluster closely with others.
The length of the branches in a Circular Dendrogram can represent the similarity or dissimilarity between entities or clusters. Two leaves or clades connected more towards the edges are more similar, whereas those connected more centrally are more dissimilar. The greater the distance between two clades, the more dissimilar they are.
Tools that can draw a Circular Dendrogram:
- Apache ECharts (JS)
- CodeSandbox (React)
- D3.js Graph Gallery (D3.js)
- Observable (D3.js)
- R Graph Gallery + R Option 2 (R)
- Radialtree (Python)
- RAWGraphs
- React Graph Gallery (React)
- SRPlot
- Vega (JS)
- ZingChart (JS)
Examples of a Circular Dendrogram
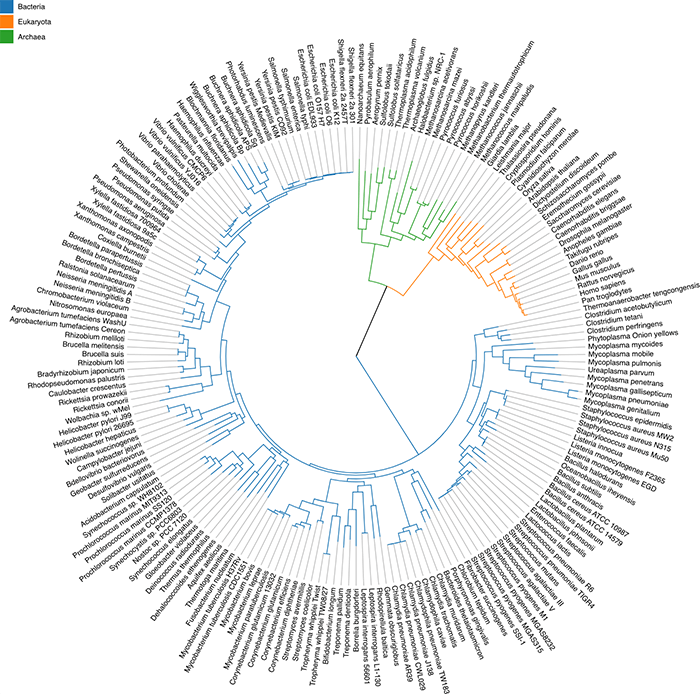
Tree of Life: A phylogenetic tree inspired by a figure from Nature and Jason Davies.
Observable, D3 – Mike Bostock
Dogs Evolution.
By Alice Bouchardon — Image via Fast Company: Infographic: How Dogs Evolved
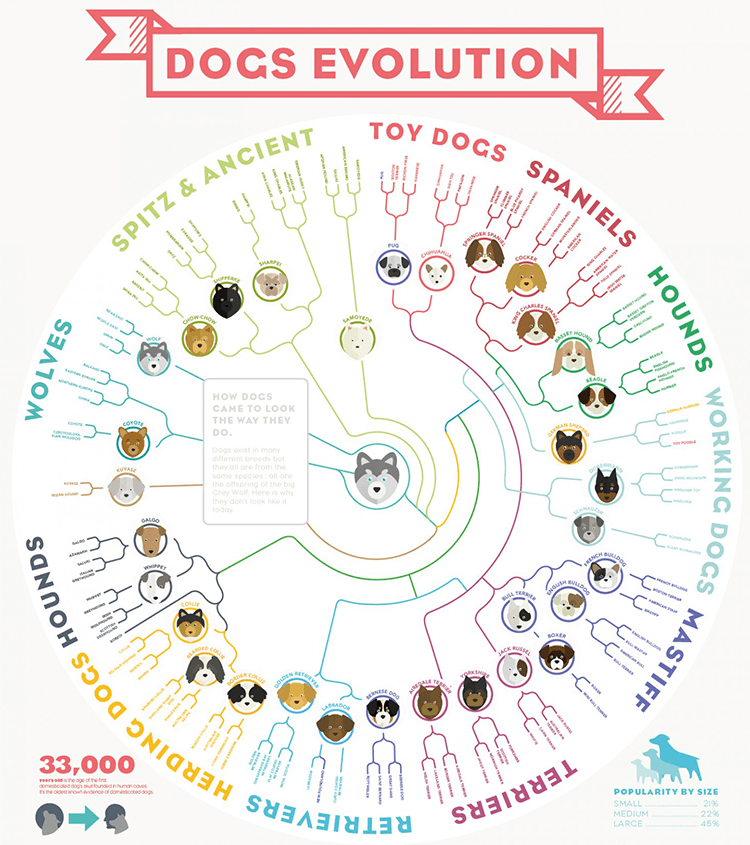
Fig. 3: ML consensus phylogenetic tree of canine RABV sequences (n = 6096).
Integrating full and partial genome sequences to decipher the global spread of canine rabies virus — Nature Communications
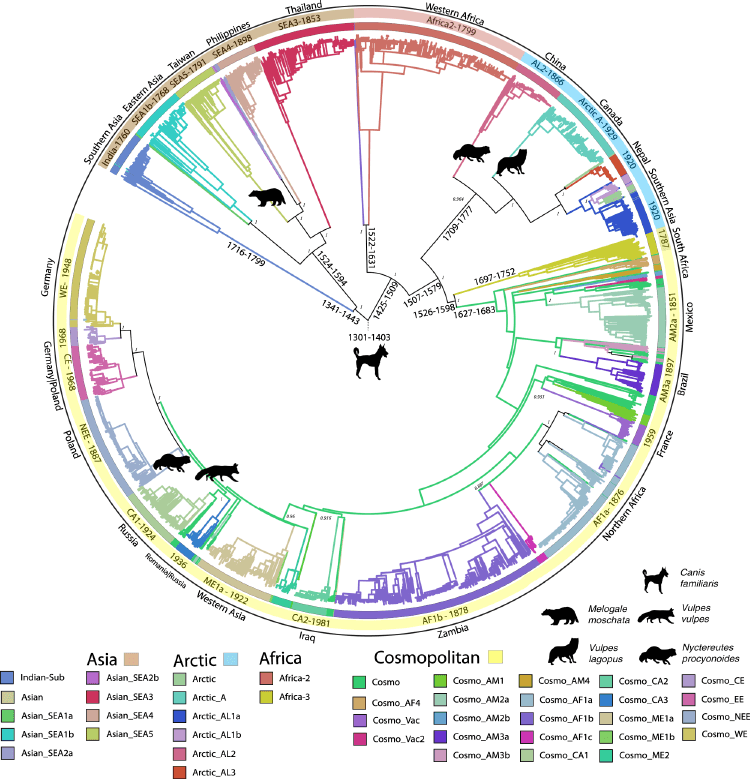
Fig 8. Phylogenetic tree of GH9. De Novo Transcriptome Analysis of the Common New Zealand Stick Insect C litarchus hookeri.
(Phasmatodea) Reveals Genes Involved in Olfaction, Digestion and Sexual Reproduction — : Wu C, Crowhurst RN, Dennis AB, Twort VG, Liu S, Newcomb RD, et al. (2016)
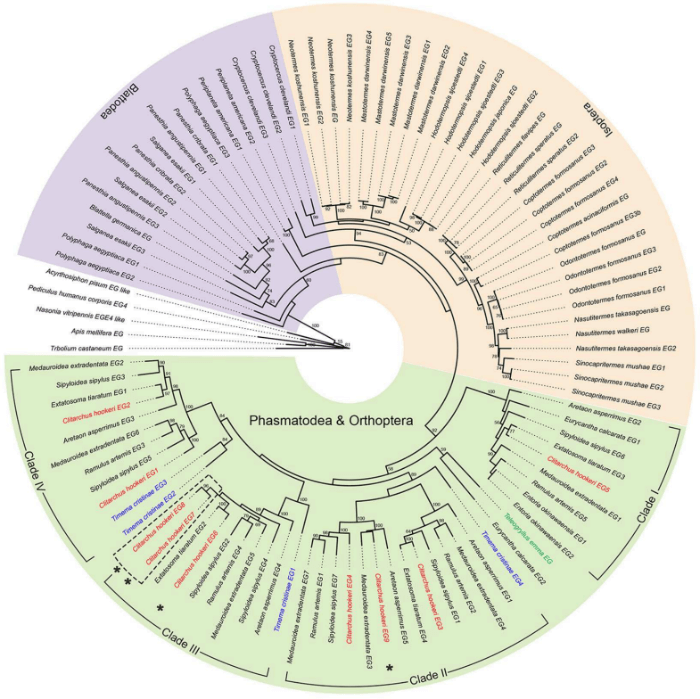
Figure 1. Circular Dendrogram with Nodes Colored Based on Different Categories.
Circular Dendrogram – Categorical Classification — Phyo Phyo Kyaw Zin
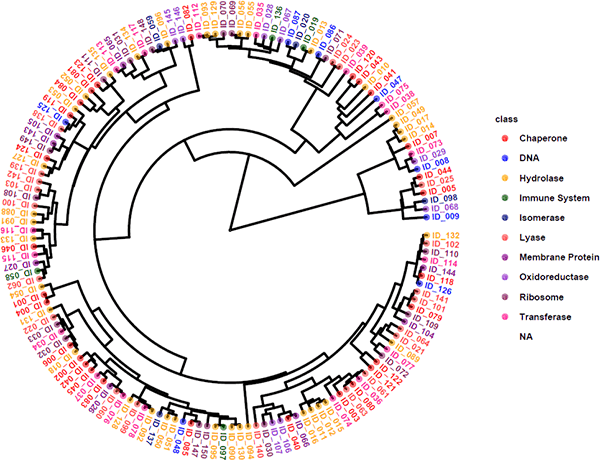
Figure 1: Phylogenetic relationships of CYP proteins from H. glycines and C. elegans.
Identification of cytochrome P450 gene family and functional analysis of HgCYP33E1 from Heterodera glycines — frontiers
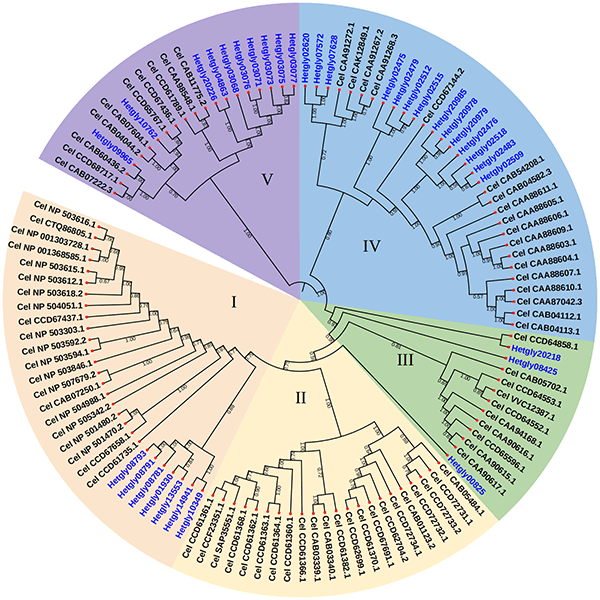
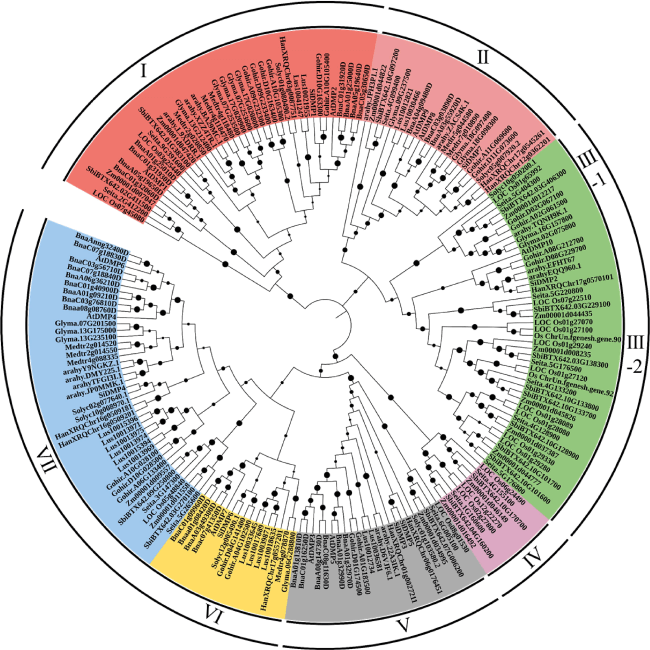
Figure 1: Phylogenetic relationships of the DMP proteins identified from monocot and dicot crops constructed using the N-J method with 1000 bootstraps in MEGAv11.
Genome-wide characterization of the soybean DOMAIN OF UNKNOWN FUNCTION 679 membrane protein gene family highlights their potential involvement in growth and stress response — Frontiers
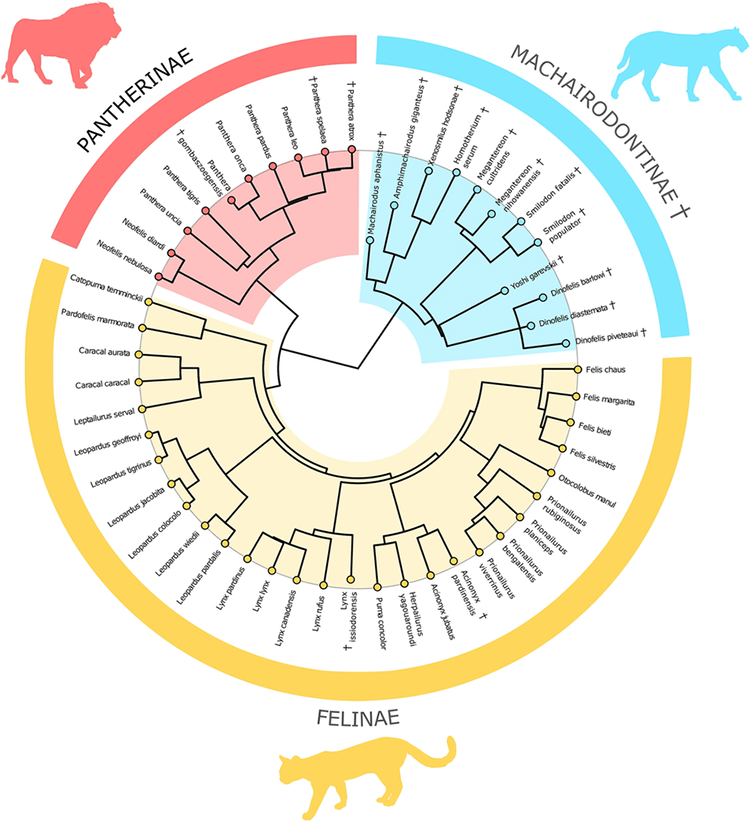
Circular dendrogram representing the phylogeny from Piras et al.⁶⁴ showing the distribution of each taxon in our allometric analyses on living and extinct felids.
Conical and sabertoothed cats as an exception to craniofacial evolutionary allometry — ResearchGate
Analysis by circular dendrogram of the hierarchical clustering identified in the raspberry panel, considering the matrices (a) Unique, (b) Mid, and (c) Moc, where each color represents a group.
Construction and genetic characterization of an interspecific raspberry hybrids panel aiming resistance to late leaf rust and adaptation to tropical regions — ResearchGate
Related posts:
Chart Snapshot: Dendrograms
