Also known as a Contiguous Cartogram or Density-Equalizing Cartogram.
A Cartogram is a type of data map that distorts the geometry of geographical regions in proportion to the data value associated with that region. So the larger the value, the more distorted and enlarged the region’s area is, while regions with lower values appear smaller.
However, while Cartograms distort the shape of geographical regions, they are still strict at preserving the connections between neighbouring regions (so remaining contiguous). Cartograms make sure not to overlap regions, and preserve the relative locations and spatial relationships between regions.
Cartograms seek to address the bias present in Choropleth Maps, where smaller regions are less visually prominent than larger regions, despite their value differences in the dataset.
Tools to generate this chart with:
D3.js
QGIS Python Plugin
R (CARTOGRAM package)
Examples
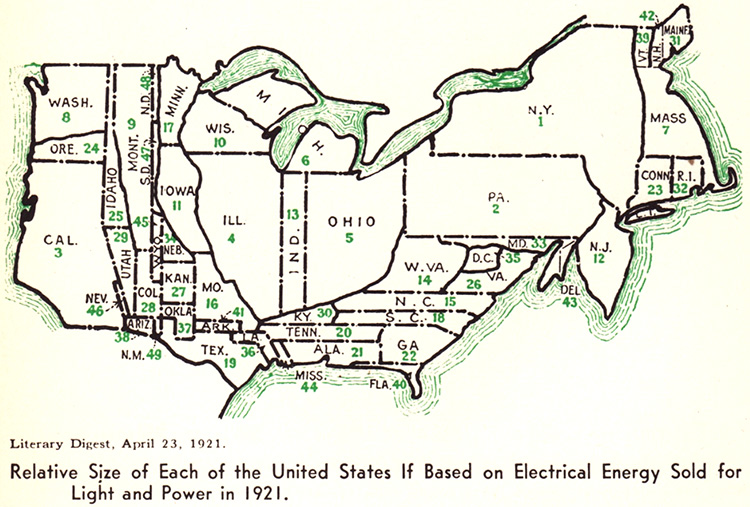
Relative Size of Each of the United States If Based on Electrical Energy Sold for Light and Power in 1921.
Cartogram — Think Design (Chart by Joseph R. Grundy)
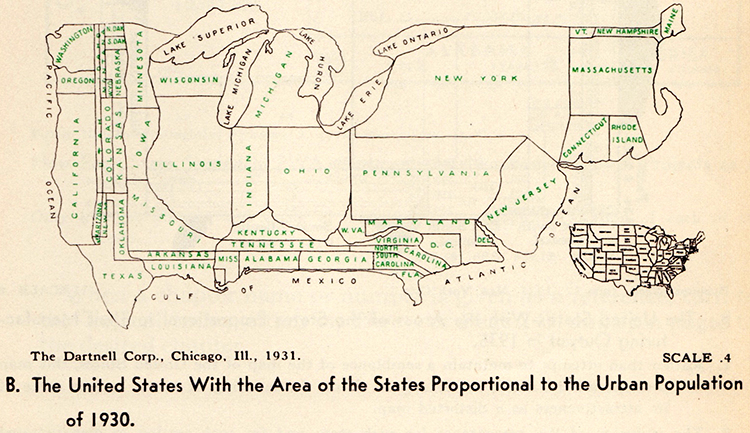
The United States With the Area of the States Proportional to the Urban Population of 1930” (The Dartnell Corp., Chicago, Ill., 1931).
More Old School Cartograms, 1921-1938 — Making Maps: DIY Cartography
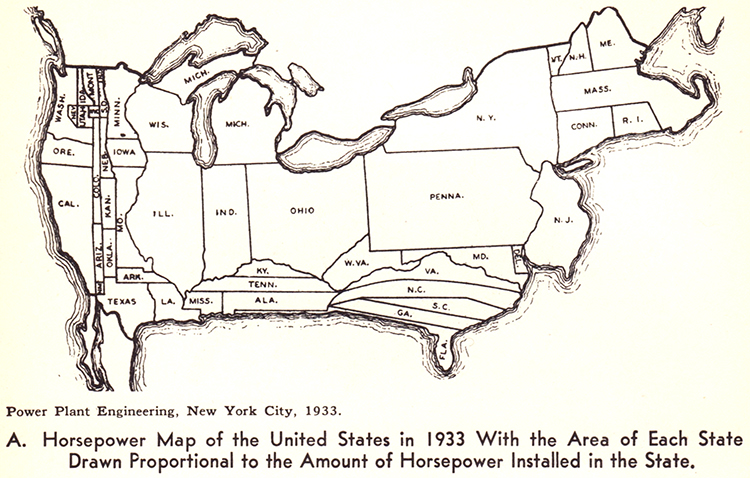
Horsepower Map of the United States in 1933 With the Area of Each State Drawn Proportional to the Amount of Horsepower Installed in the State” (Power Plant Engineering, New York City, 1933).
More Old School Cartograms, 1921-1938 — Making Maps: DIY Cartography
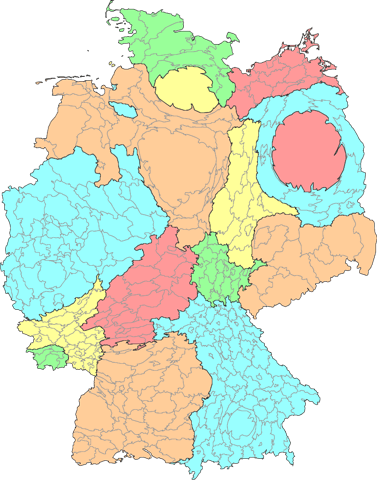
Cartogram of Germany, with the states and districts resized according to population.
Wikipedia — Christoph Stoepel
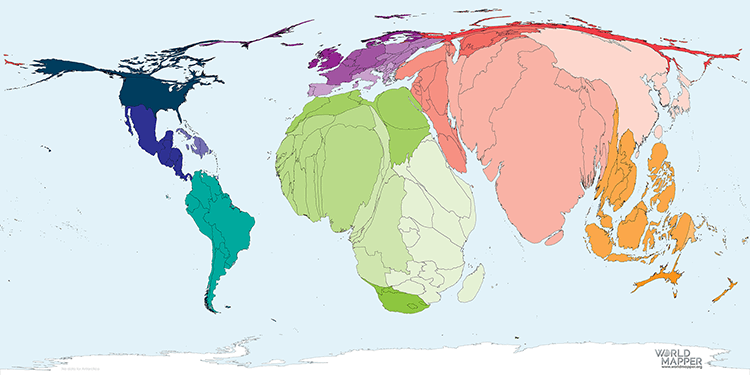
Total Births 2022.
World Mapper
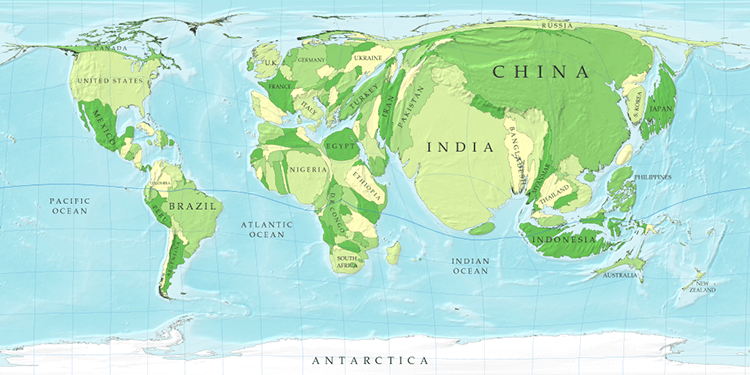
A Cartogram of the World’s Population.
Map of the Week 6 (October 21-27): A Cartogram of the World’s Population — Mappenstance
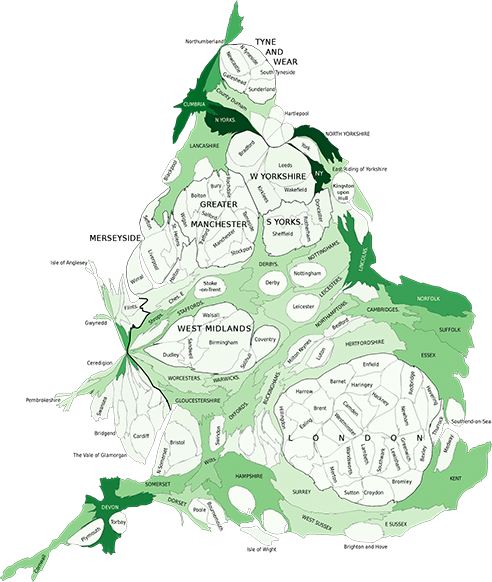
England and Wales population cartogram.
Wikipedia / PawełS
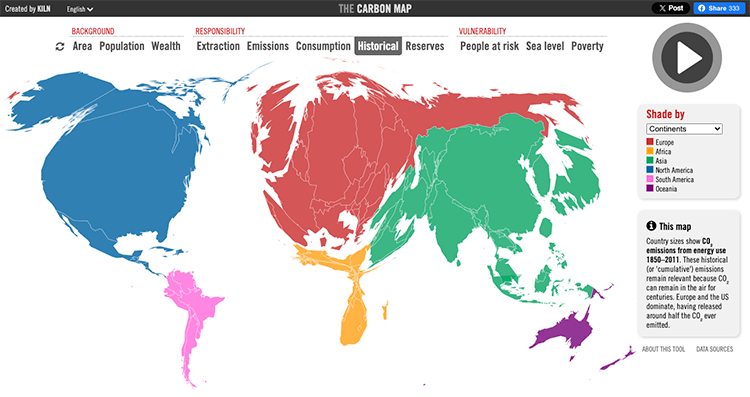
THE CARBON MAP (Responsibility: Historical).
KILN / Duncan Clark and Robin Houston
Related posts:
Further Exploration #6 Cartograms
