For this website, I’ve started to compile a list of academic papers and any related articles that study or use a particular type of visualisation.
I thought it would be a good idea to share what I have found since there isn’t a resource (that I know of), which list papers and journal articles by chart type.
So this entry, I will be listing and briefly reviewing all the research I’ve found on Alluvial Diagrams. Most of the research listed below focuses on the applications of Alluvial Diagrams, but in recent years more research has been done on the construction and design of Alluvial Diagrams.
Mapping Change in Large Networks (2010)
By Martin Rosvall , Carl T. Bergstrom
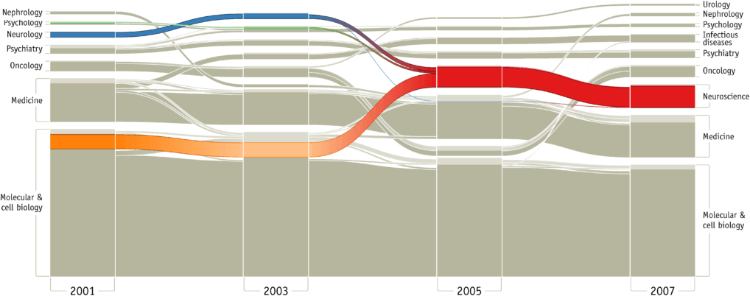
This was the first paper to introduce the “Alluvial Diagram” and used this new visualisation to visually represent the change in a large and complex network structure over time. The network visualised was the citations between around 7000 scientific journals over a decade. The Alluvial Diagram was developed in this paper to identify the emergence of new fields born from the fusion of established scientific fields.
https://doi.org/10.1371/journal.pone.0008694
Featured graphic. Mapping shifting hierarchical and regional tendencies in an urban network through alluvial diagrams (2013)
By Xingjian Liu, Ben Derudder, György Csomós, Peter Taylor
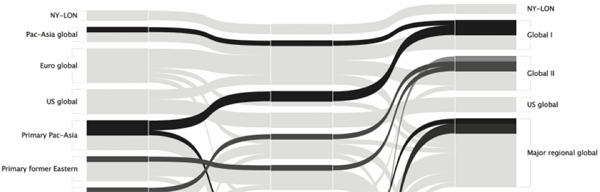
This entry continues from the work of Rosvall and Bergstrom and applies the Alluvial Diagram to visualising the evolution of international connectedness in urban areas caused by globalising producer services companies.
https://doi.org/10.1068/a45488
Mapping the evolution of hierarchical and regional tendencies in the world city network, 2000-2010 (2014)
By Xingjian Liu, Ben Derudder, Peter Taylor
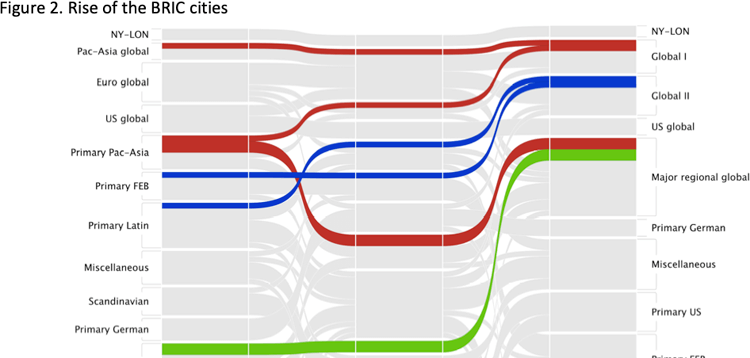
This article is a more in-depth version of the previous one, where the authors highlighted the changes in hierarchical and regional patterns in the world city network.
https://doi.org/10.1016/j.compenvurbsys.2013.10.004
Detecting Dynamics of Hot Topics with Alluvial Diagrams: A Timeline Visualization (2017)
By Wenjing Ruan, Haiyan Hou and Zhigang Hu
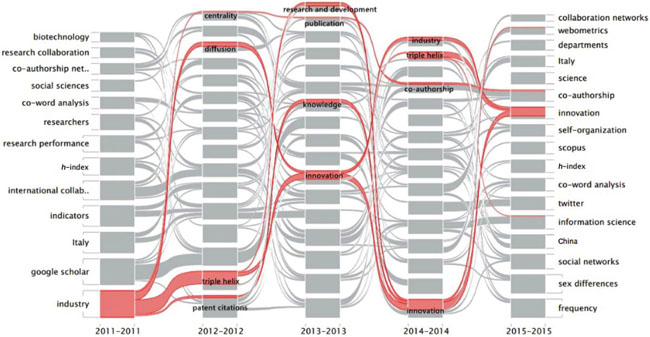
Like the Rosvall and Bergstrom paper, this article analyses the connections in scientific research but uses a different technique of focusing on the “hot topics” instead of citations. Also, the data used in this article focuses on the dynamic changes in the field of ‘scientometrics’ from 2011 to 2015. Using an Alluvial Diagram provided the ability to track a field of interest and which cluster it belonged to over a time period. Thus showing the shifts in researchers’ interests and changing research objectives.
https://doi.org/10.1515/jdis-2017-0013
Data Visualization by Alluvial Diagrams for Bibliometric Reports, Systematic Reviews and Meta-Analyses (2017)
By Andy Wai Kan Yeung
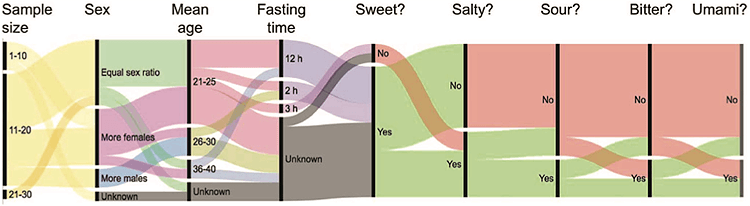
This short article demonstrates the usage of Alluvial Diagrams outside that of just showing network changes over time. Instead, Yeung visualises two datsets: one on demographic data and another on a bibliometric report. Both datasets produce Alluvial Diagrams that show the flow and ratios between various categorical dimensions.
http://doi.org/10.18520/cs/v115/i10/1942-1947
Visualizing changes in nationally averaged PM2.5 concentrations by an alluvial diagram (2017)
By Ying Liu, Naizhuo Zhao, Jennifer K Vanos, Guofeng Cao
In this article, an Alluvial Diagram is used to visualise the amount of ambient fine particulate matter changing over time across various countries. Here, the focus is on communicating the change in rankings across countries and the proportions between them. However, because of the structural difference in the visualisation used here, I would argue that it’s not an Alluvial Diagram and instead more resembles a weighted Bump Chart.
https://doi.org/10.1177/0308518X17745067
ggalluvial: Layered Grammar for Alluvial Plots (2020)
By Jason Cory Brunson
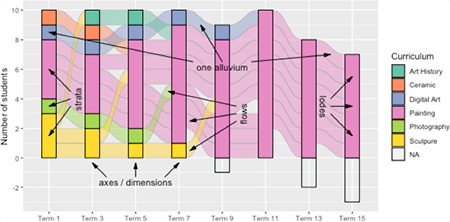
This is the accompanying paper to the ggalluvial package for the R ecosystem. Here Brunson primarily documents the construction of Alluvial Diagrams within R, while also discussing and examining the applications for this type of visualisation. Brunson also touches on the differences between Alluvial Diagrams, Sankey Diagrams, and Parallel Sets and how they’re often conflated.
https://doi.org/10.21105/joss.02017
Bayesian Modelling of Alluvial Diagram Complexity (2021)
By Anjana Arunkumar, Shashank Ginjpalli, Chris Bryan
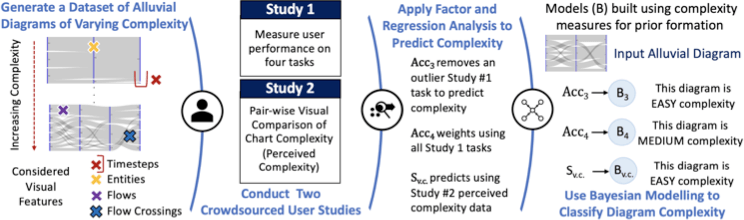
This is the first piece of research that empirically assesses, quantifies, and models the complexity of Alluvial Diagrams to aid in improving their effectiveness. Here, a technique is developed using Bayesian methods and by looking at the visual features that contributes to a visualisation’s complexity.
