 Page top
 Previous
 Homepage
 Next
Next
Tree Diagram
Description
Also known as a Organisational chart, Linkage Tree.
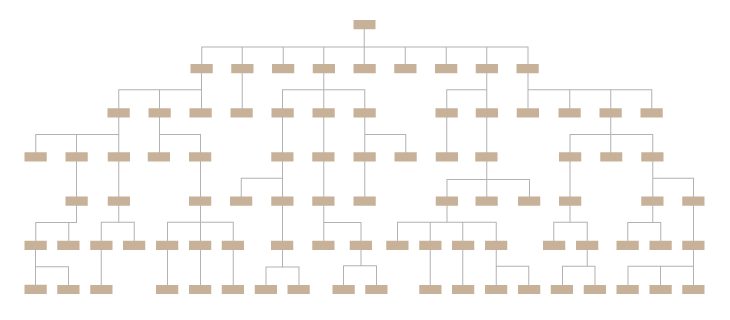
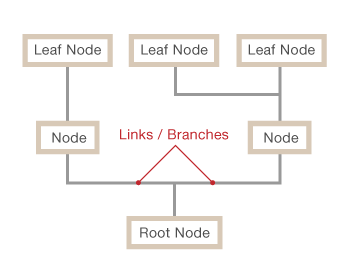
A Tree Diagram is a way of visually representing hierarchy in a tree-like structure. Typically the structure of a Tree Diagram consists of elements such as a root node, a member that has no superior/parent. Then there are the nodes, which are linked together with line connections called branches that represent the relationships and connections between the members. Finally, the leaf nodes (or end-nodes) are members who have no children or child nodes.
Tree Diagrams are often used:
To show family relations and descent.
In taxonomy, the practice and science of classification.
In evolutionary science, to show the origin of species.
In computer science and mathematics.
In businesses and organisations for managerial purposes.
Functions
Anatomy
Variations
Dendrogram, Radial Tree DiagramTools to Generate Visualisation
Code-based:
Apache ECharts (JS)
Google Chart (HTML5)
JSCharting (JS)
yFiles
ZingChart (JS)
ZoomCharts (JS)
Webapp:
Gliffy
Google Docs
Vizzlo
yEd Live
Check out our fast-paced, data visualisation-themed card game:

Merchandise & other related dataviz products can be found at the store.

