While Poland boasts a thriving tech industry and a burgeoning interest in data-related fields, there remains a noticeable void when it comes to specialising in data visualisation. Recognising this gap, I would like to attempt to provide on-site training by first starting with something introductory.
The goal is to provide participants with a foundational understanding of the field and guidance on how to start a career in data visualisation or add it as a tool to an existing career. The focus is on theory and practice rather than on technical skills, so no computers are required to attend. Instead, low-tech learning tools such as card games are employed to make the learning experience fun and collaborative. I wanted to keep the training tool agnostic to allow of flexibility for any career paths.
Training Outline
Introduction
– Definitions and Terminology
– Why is data visualisation useful?
– Infographics VS Data Visualisation
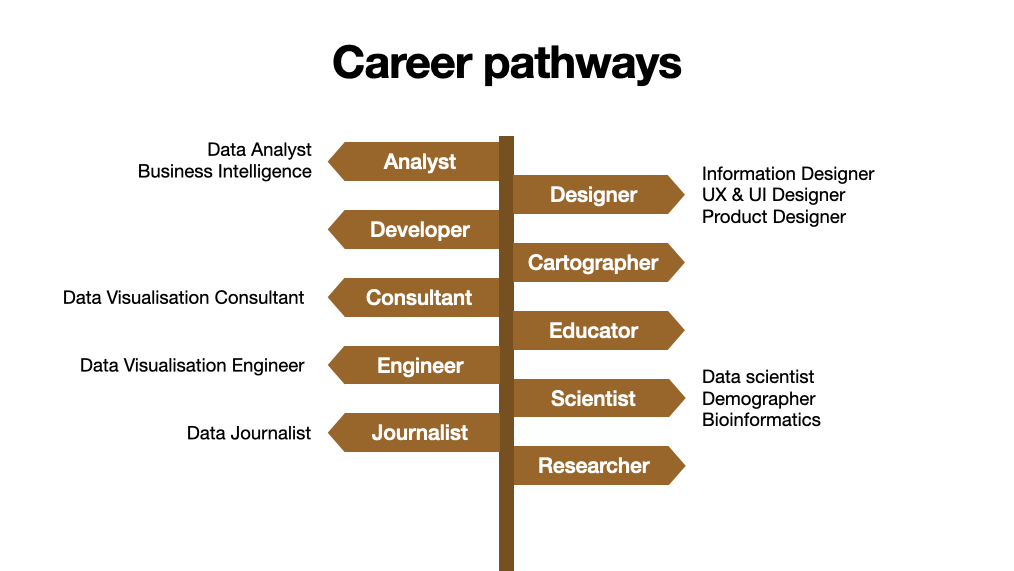
– Career pathways
Visualisation Vocabulary
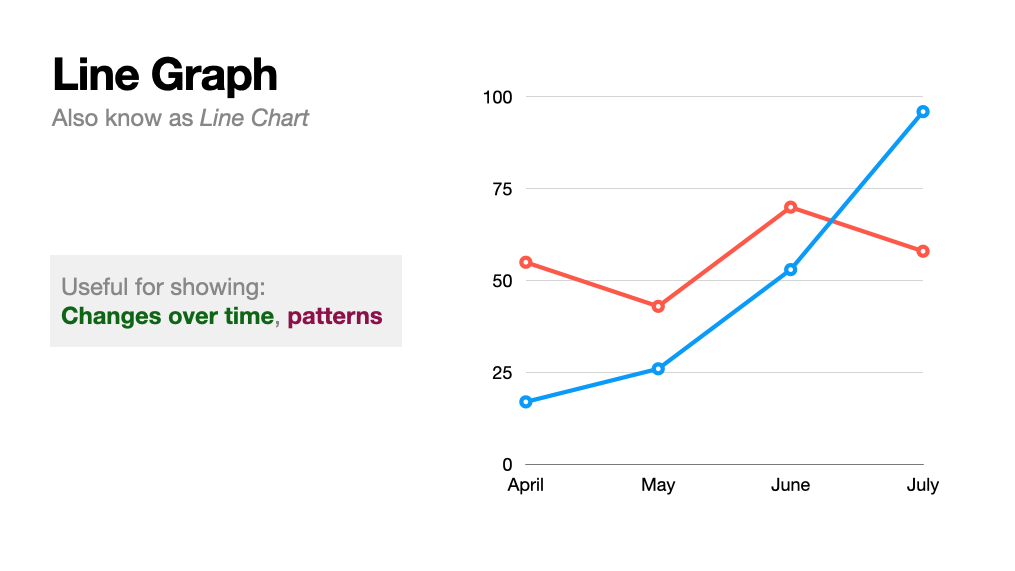
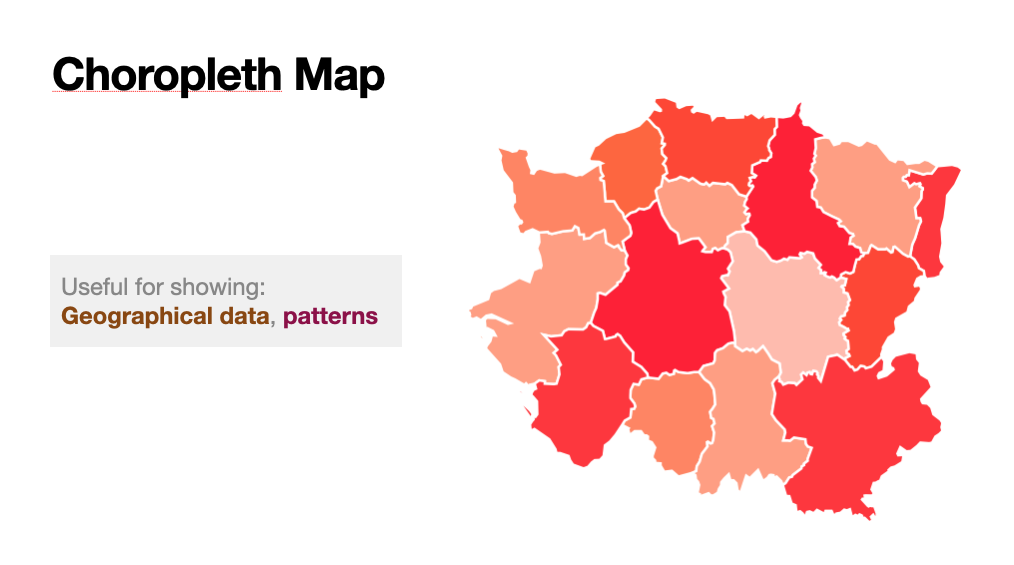
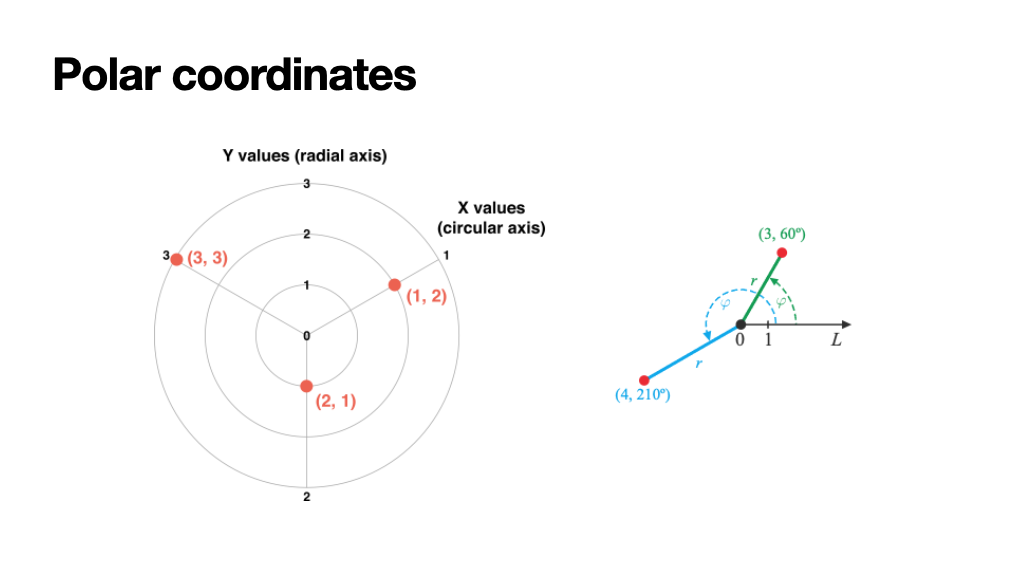
– Common chart types
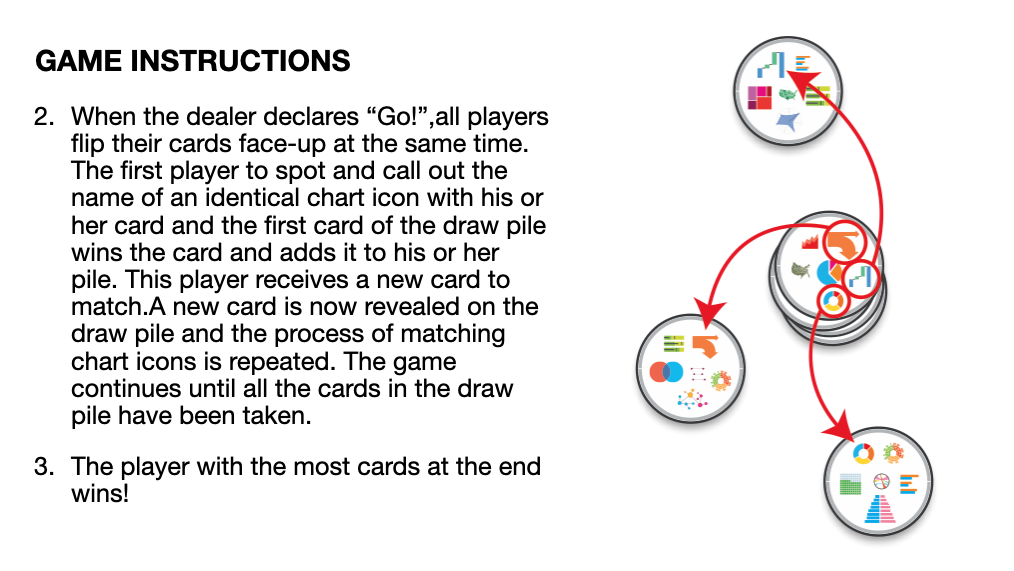
– Match It Game session
Key Principles
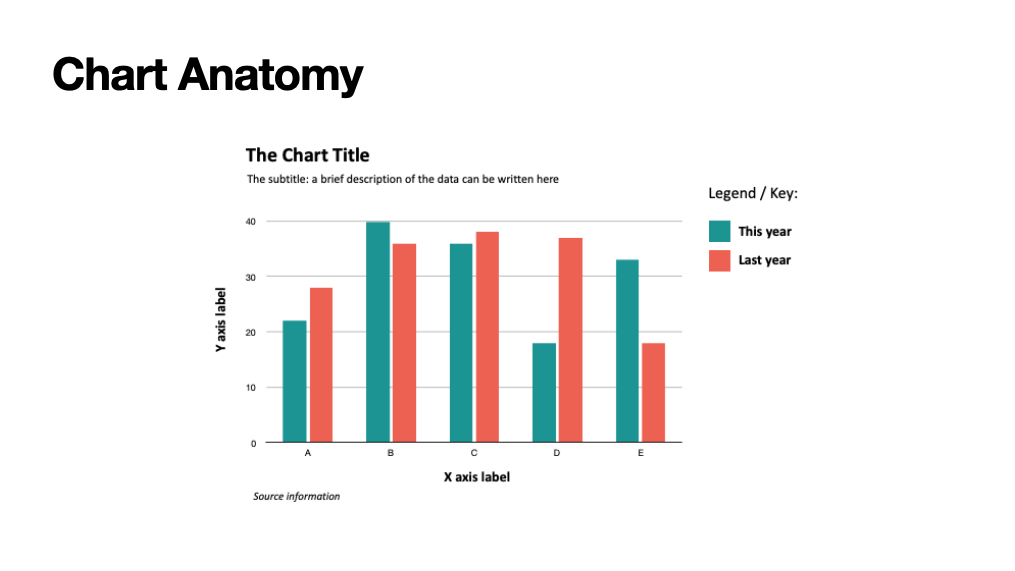
– Chart Anatomy
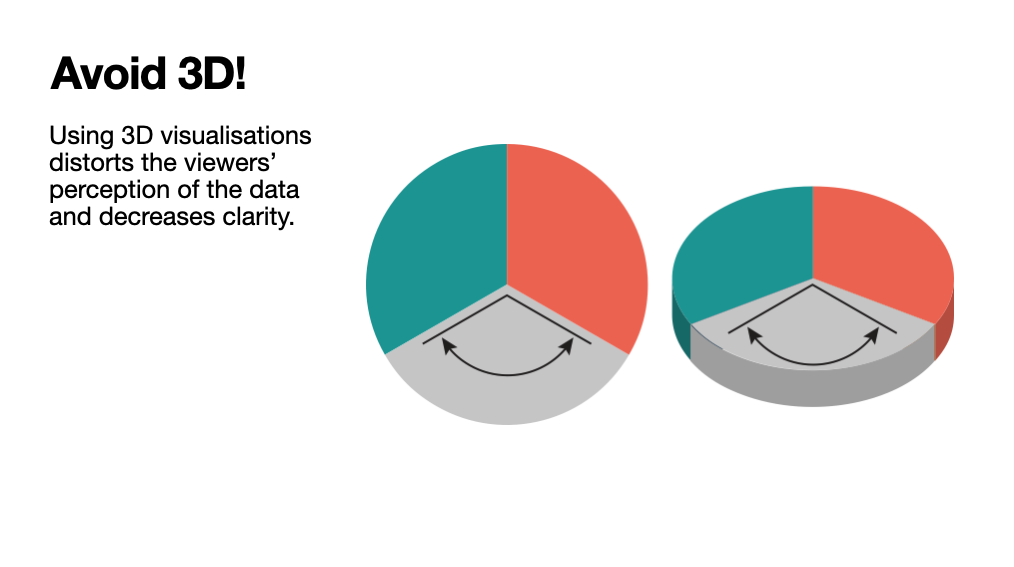
– General best charting practices
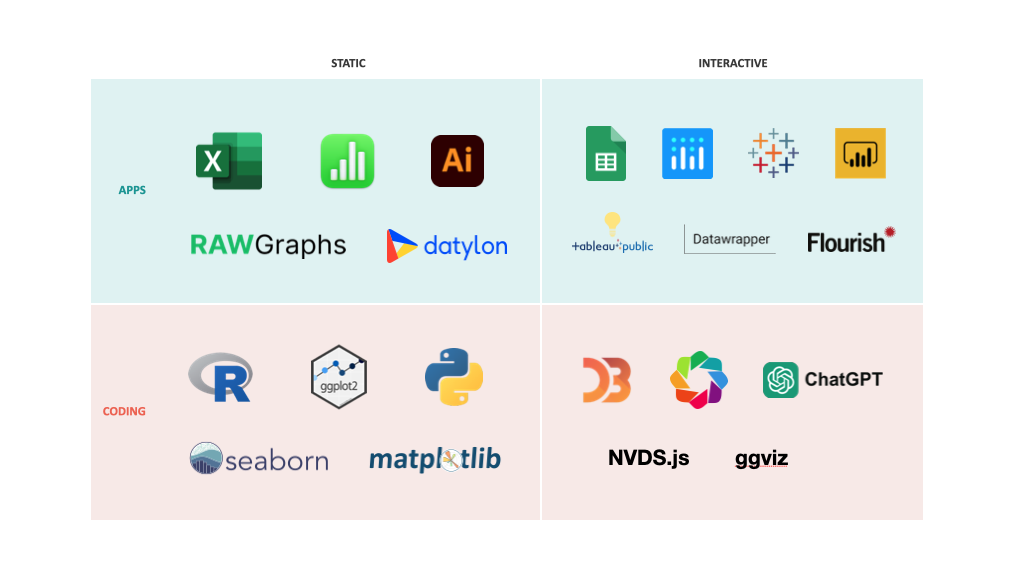
Tools
– Code-based
– Desktop Applications
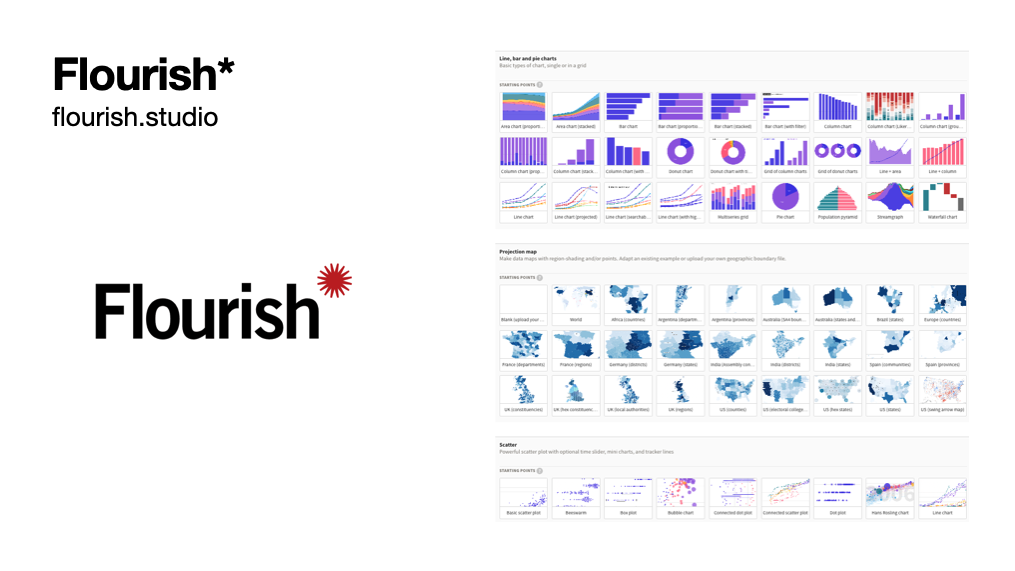
– Web Applications
– Artificial Intelligence
– Which tool should I use?
Resource Recommendations
– Websites
– Books
A free course notes document containing the training content is included, providing a resource for future referencing.
Who is this for?
If you are someone eager to embark on a career in data visualisation, this training provides the perfect foundation to kickstart your journey. Likewise, if you possess a vague understanding of data visualisation and seek to deepen your knowledge, then this training is designed to meet your needs. Moreover, professionals currently working in roles that involve handling data but lack the expertise in leveraging data visualisation will find this training a great way to add it to their toolkit.
Presentation Preview

Location and Duration
The venue in Kraków still needs to be determined, but training can of course be provided on-site so long as there’s an adequate conference room. Training outside of Kraków is possible providing that there are good transport links to the required location.
Typically, the training runs up to 5 hours, with an hour lunch break and two short 15-minute breaks. The start time and breaks can be flexible.
Interested?
The training page and application form are located here. Please get in contact if you have any questions.
The training will be delivered in English, as unfortunately currently my Polish isn’t good enough.

