For those who haven’t learnt how to use Data Illustrator, I’ve provided a tutorial on how to construct Bar Charts in the Application.
Tutorials
Tutorials I’ve written.

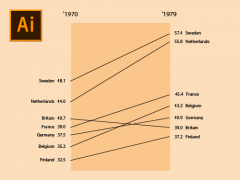
A Slopegraph is great for comparing the ‘before and after’ changes in quantities between two time periods. In this tutorial, I will show you how […]

