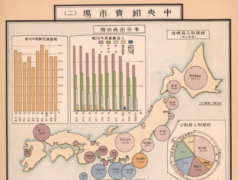
Exploring some historical examples of Japanese data visualisation and the charts that were invented there.
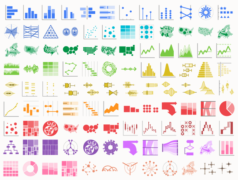
Posts related to my documented research into the different charts types that I’ve discovered.
While I’m no longer updating the main page with new visualization methods, I’m still continuing to research into different chart types, which you can find in these posts below.
Exploring some historical examples of Japanese data visualisation and the charts that were invented there.
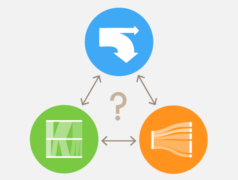
An attempt at clarifying their differences.
Which chart type do I select to communicate a particular message and/or analyse the property of a dataset?
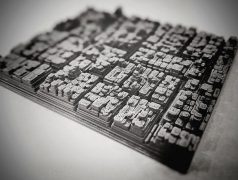
Looking at projects that have used 3D Treemaps that use extrusion to visualise an additional variable.
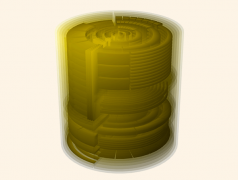
Continuing on at exploring 3D Treemaps, this post takes a look at Treemaps that use spheres or cyclinders in their design.

Looking through 3D Treemaps that use a cube design, such as the Information Cube, the Treecube, and the Magic Treemap Cube.
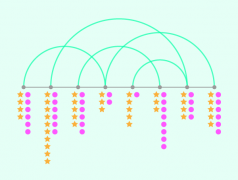
Here’s a list of different charts that can be combined with an Arc Diagram to display additional data.
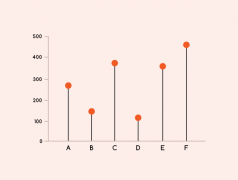
Looking at: Lollipop Chart, Triangle Bar Chart, Back-To-Back Bar Chart, Progressive Bar Chart, Waterfall Chart, Change Bar Chart, Pareto Chart and more.
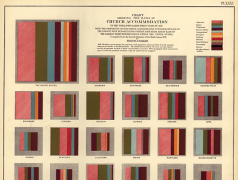
Here are 34 different charts that you can combine a Proportional Area Chart with.

Exploring some of the different ways Proportional Area Charts can be used.
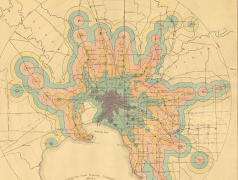
Exploring the many variations of Isochrone Maps from both the past and present.

I wanted to document all variations of Tile Grid Maps that I’ve come across and also draw combinations that I think are possible.
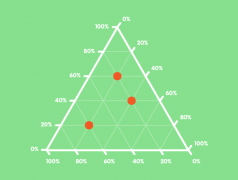
This post explores the various kinds of triangular (tri-axes) graphs that are currently being used. Most notably, Ternary Graphs are their variations.
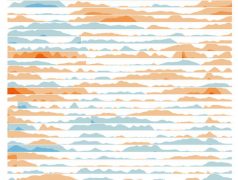
In this post, I will look through the many types of Area Graphs that exist, that I haven’t touched on in the past.
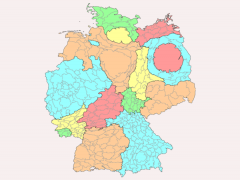
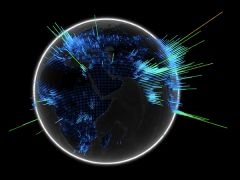
Instead of displaying data over geographical regions, Cartograms communicate data values by manipulating the forms of those geographical regions.
While I’ve already covered Box Plots, there are a series of Box Plot variations that can display the distribution of data over two, three or even more dimensions.
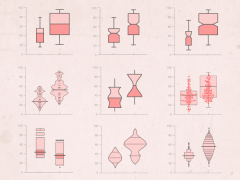
Originally introduced and popularised by the American mathematician John Wilder Tukey, a Box Plot (also known as a Box and Whisker Plot) is a type […]
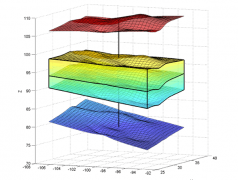
In the last two posts (#1 and #2), I specifically looked a range of 3D charts, but didn’t included any 3D maps to display geographical […]


