 Page top
 Previous
 Homepage
 Next
Next
Treemap

Description
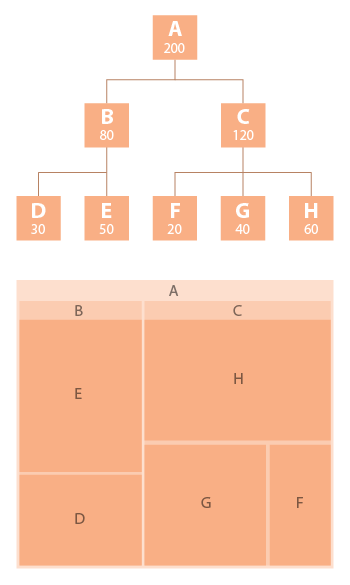
Treemaps are an alternative way of visualising the hierarchical structure of a Tree Diagram while also displaying quantities for each category via area size. Each category is assigned a rectangle area with the subcategory rectangles nested inside.
When a quantity is assigned to a category, its area size is in proportion to that quantity and any other quantities within the same parent category in a part-to-whole relationship. Also, the area size of the parent category is the total of its subcategories. If no quantity has been assigned to a subcategory, then its area is divided equally amongst the other subcategories within the parent category.
The way rectangles are divided and ordered into sub-rectangles depends on the tiling algorithm used. Many tiling algorithms have been developed, but the "squarified algorithm", which keeps each rectangle as square-like as possible is the one commonly used.
Ben Shneiderman originally developed Treemaps as a way of visualising a vast file directory on a computer, without taking up too much space on the screen. This makes Treemaps a more compact and space-efficient option for displaying hierarchies, that can give a quick overview of the hierarcal structure. Treemaps are also great at comparing the proportions between categories via their area size.
The downside to Treemaps is that they doesn't show the hierarchal levels as clearly as other charts that visualise hierarchal data (such as a Tree Diagram or Sunburst Diagram).
Functions
Anatomy


Tools to Generate Visualisation
Code-based:
amCharts (JS)
AnyChart (JS)
Apache ECharts (JS)
D3.js Graph Gallery (D3.js)
FusionCharts (JS)
Google Charts (HTML5)
Highcharts (JS)
jChartFX (JS)
JSCharting (JS)
Observable (D3.js)
Plotly (JS)
Python Graph Gallery (squarify, matplotlib)
R Graph Gallery (R: treemap)
Vega
yFiles
ZingChart (JS)
Webapp:
Datamatic
Datylon
Flourish
Google Docs
Infogram
plotDB
RAWGraphs
Slemma
Vizzlo
Desktop App:
Microsoft Office
Tableau
Check out our fast-paced, data visualisation-themed card game:
Merchandise & other related dataviz products can be found at the store.

