 Page top
 Previous
 Homepage
 Next
Next
Sankey Diagram

Description
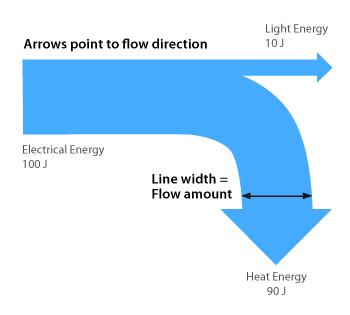
Sankey Diagrams display flows and their quantities in proportion to one another. Typically, Sankey Diagrams are used to visually represent the transfer of energy, money, materials, or the flow of any isolated system or process.
The thickness of the arrows and lines shows their magnitudes or quantities. Flow arrows or lines can combine or split apart at each stage of a process.
Colour can be used to divide the diagram into different categories or to show the transition from one state of the process to another.
Often, Sankey Diagrams are confused with Parallel Sets and Alluvial Diagrams, but this post clarifies the differences.
Functions
Anatomy


Tools to Generate Visualisation
Code-based:
amCharts (JS)
AnyChart (JS)
Apache ECharts (JS)
D3.js Graph Gallery (D3.js)
FusionCharts
Google Charts (HTML5)
Matplotlib (Python)
Plotly (JS)
Python Graph Gallery (plotly, pySankey, matplotlib)
R Graph Gallery (R: networkD3)
Tamc (JS)
yFiles
Webapp:
Flourish
RAWGraphs
SankeyArt
SankeyDiagram.net
Sankey Flow Show
SankeyMATIC
The Sankey Diagram Generator
Desktop App:
e!Sankey
SDraw
Vizzlo
Check out our fast-paced, data visualisation-themed card game:

Merchandise & other related dataviz products can be found at the store.

