 Page top
 Previous
 Homepage
 Next
Next
Area Graph
Description
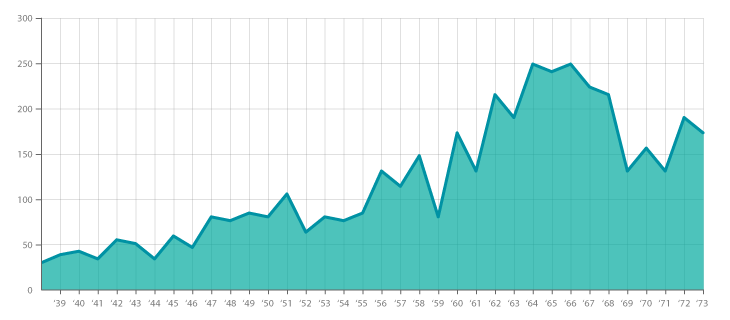
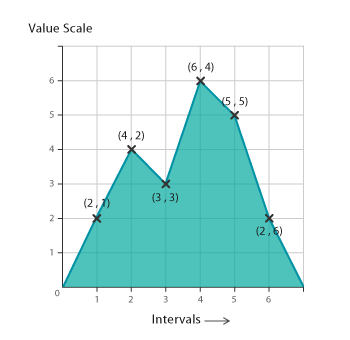
Area Graphs are Line Graphs but with the area below the line filled in with a certain colour or texture. Area Graphs are drawn by first plotting data points on a Cartesian coordinate grid, joining a line between the points and finally filling in the space below the completed line.
Like Line Graphs, Area Graphs are used to display the development of quantitative values over an interval or time period. They are most commonly used to show trends, rather than convey specific values.
Two popular variations of Area Graphs are: grouped and Stacked Area Graphs. Grouped Area Graphs start from the same zero axis, while Stacked Area Graphs have each data series start from the point left by the previous data series.
Functions
Anatomy


Tools to Generate Visualisation
Code-based:
AnyChart (JS)
amCharts (JS)
CanvasJS (JS)
Chart.js (JS)
FusionCharts (JS)
Google Charts (HTML5)
JSCharting (JS)
Highcharts
Mike Bostock’s Block (D3)
plotly (JS)
Python Graph Gallery (Python: matplotlib + seaborn)
R Graph Gallery (R: ggplot2)
Vega
Vega-Lite
ZingChart (JS)
ZoomCharts (JS)
Webapp:
Datamatic
Datawrapper
Datylon
Flourish
Google Docs
Infogram
Online Charts
Slemma
Vizzlo
Desktop App:
Adobe Illustrator
Apple: Numbers / Keynote / Pages
Microsoft: Excel / PowerPoint / Word / PowerBI
Tableau
Check out our fast-paced, data visualisation-themed card game:

Merchandise & other related dataviz products can be found at the store.

