So in the previous post in the series, I covered Treemap visualisations that use a 3D cube shape to displays hierarchal data. However, there are still a number of different 3D Treemap visualisations that I need to cover, in particular, 3D Treemaps that used spheres or cylinders.
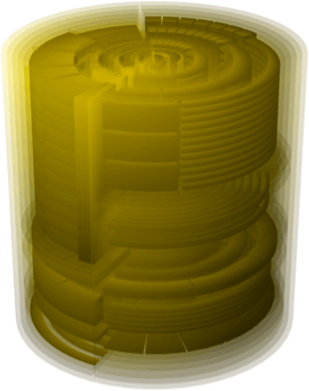
3D Polar Treemap
This visualisation was created in 2011 by Hans-Jörg Schulz, Steffen Hadlak and Heidrun Schumann in their paper The Design Space of Implicit Hierarchy Visualization: A Survey (p. 10). This experimental visualisation uses a polar layout and extends into into 3D with a cylindrical form.
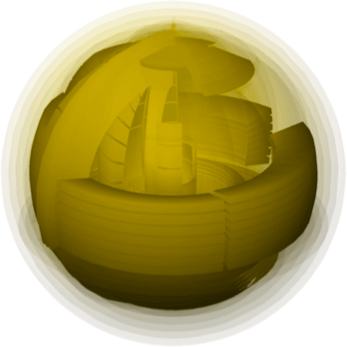
A spherical variation was also tested out:
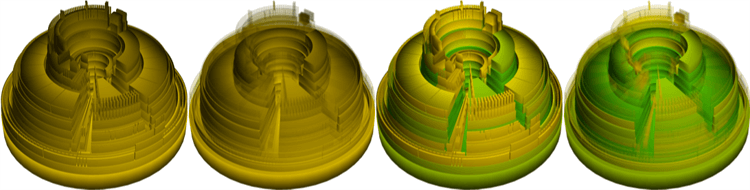
3D Polar Steptree
Another experimental variation of a Treemap was carried out by Schulz and co, by taking the 3D Polar Treemap a step further by combining it with elements of the Steptree.
Strata Treemap
One of main limitations of a Treemap is that it more difficult to discern the hierarchal structure than a Tree Diagram for example. So to solve this problem, Junghong Choi, Oh-hyun Kwon and Kyungwon Lee developed their own variation of a Treemap, which they named the Strata Treemap.
[…]Strata treemap, a new approach to treemap presentation that im- proves the visibility of the hierarchical structure without distorting the node sizes. Strata treemaps are based on Voronoi treemap. Strata treemap use the surface of a sphere instead of the traditional two-dimensional plane. For each node in the hierarchy, we extrude it along the its surface normal and stack up on the its parent. The result is a three-dimensional shape that consists of stacked blocks on a sphere. Each block represents a node in a hierarchy and its top surface area represents the quantitative value of the node.[…]
~ Strata Treemaps, p. 1
SphereTree
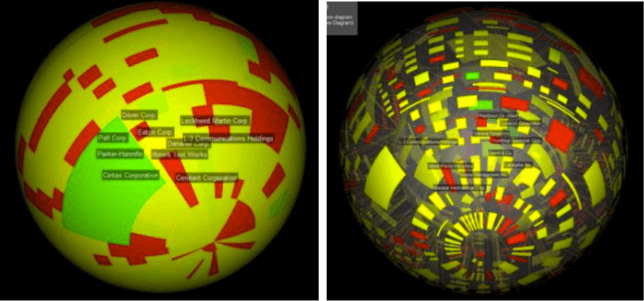
In their paper Sphere-based Information Visualization: Challenges and Benefits, Richard Brath and Peter MacMurchy documented their attempts at creating sphere-based Treemaps for the Oculus.
[…]An attempt was made to “mash” visual techniques together: SphereTree attempted to combine a treemap e.g. [Joh91, Bru99] projected onto a sphere together with an internal hierarchy through the center of the sphere. The hierarchy was presented as a successive series of concentric shells, with each treemap not completely filling its area, leaving gaps to view each successive underlying shell. Difficulties with visually associating patches of the treemap with the corresponding parent/children within the hierarchy led to some iterative exploration and adjustments, eventually settling on replacing the inner shells with a ball-and-stick hierarchy inside the sphere.[…]
~ Sphere-based Information Visualization: Challenges and Benefits, p. 4