You’ll be surprised what you find on the Web. A number of let’s say, enthusiastic people have permanently imprinted into themselves tattoos in the form of charts. As much as I like data visualisation, I don’t think you’ll ever see me tattoo a chart into myself. But for me, this is a curiosity that I had to look into.
The Tree of Life
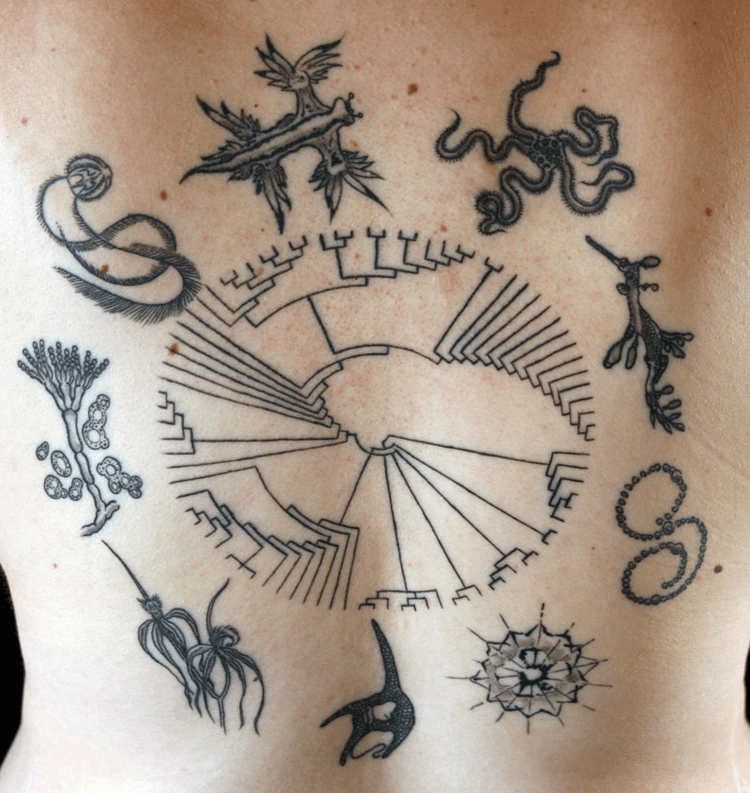
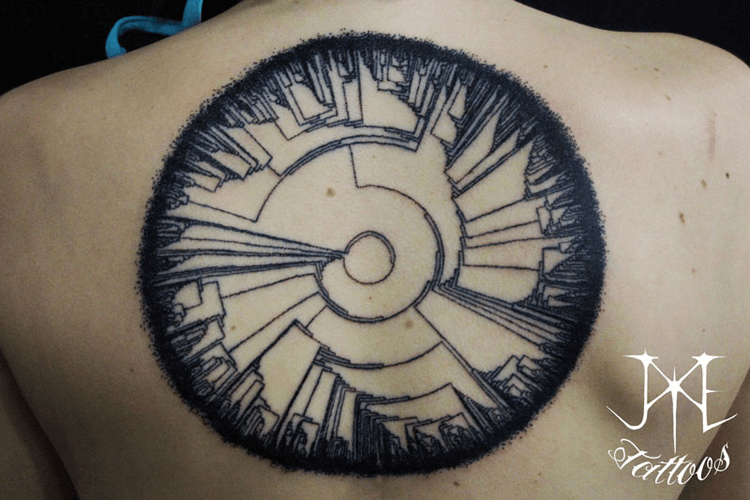
Below are examples of chart tattoos that visualise the 3000 different lifeforms that have been discovered on Earth. Using their skin as a canvas, these two people (one a Ph.D student in Biology) have use a circular dendrogram to display the various clustering of species. In one tattoo, the artwork of each species category has been placed along with the chart. You can find more examples here of Tree of Life chart tattoos.
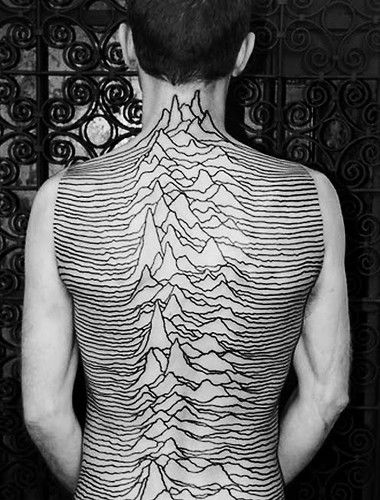
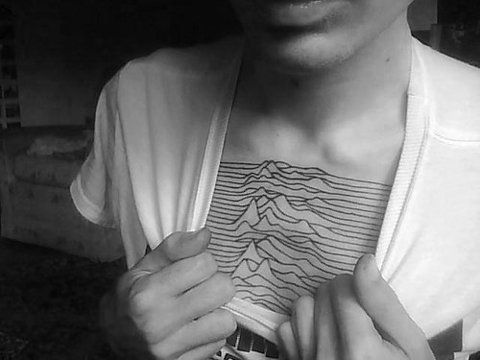
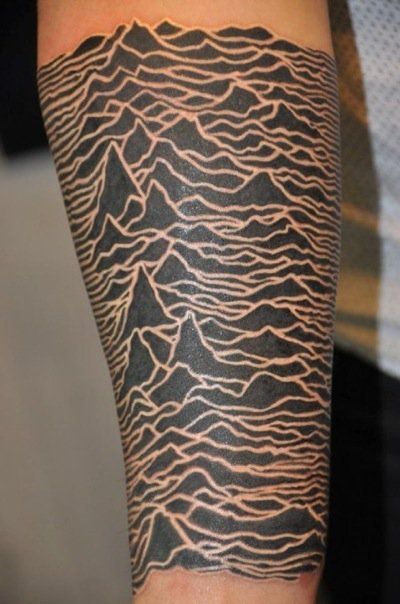
Joy Division’s Unknown Pleasures Album Art
Originally designed by Peter Saville, this famous album cover visualises pulsar data using a stacked plot. A number people have adapted the album art on different parts of their bodies:
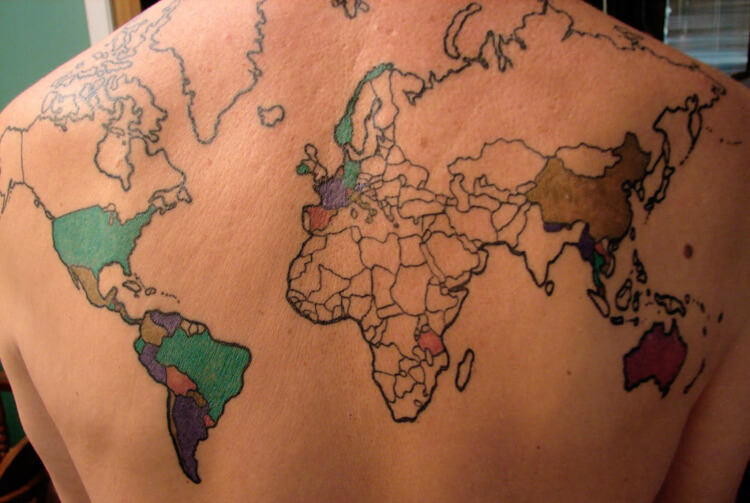
Recording Each Country Visited Tattoo
A travel blogger by the name of Bill Passman has expressed his passion for travelling by tattooing on his top back the World map. Each time Passman visits a country he gets it filled in. Eventually, I image his goal will be to have the entire tattoo coloured in.
Mapping Casualties During Operation Iraqi Freedom
Here’s another guy who’s tattooed a map onto his back – however, in this example the inspiration is not so cheery.
Back in 2004, the brother of the Iraqi artist Wafaa Bilal, was killed by a missile at a checkpoint in their hometown of Kufa, Iraq. Grieving from his loss, Bilal felt empathy for all those families on both sides of the conflict who had lost their loved ones.
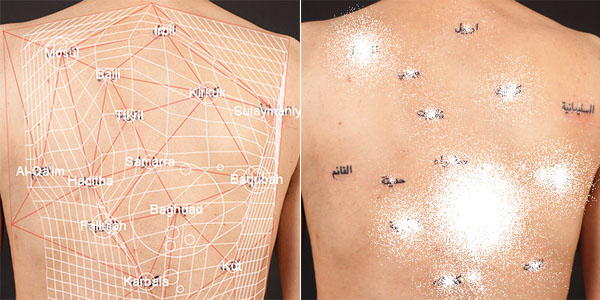
So to commemorate the loss of life during this war, Bilal organised a piece of performance art where a full-back tattoo (designed by Kyle McDonald) was inked into Bilal over the span of 24 hours. This performance piece ran in conjunction with a fundraiser that collected $1 per death. The money was used to award scholarships to Americans and Iraqis children who had lost their parents in the war.
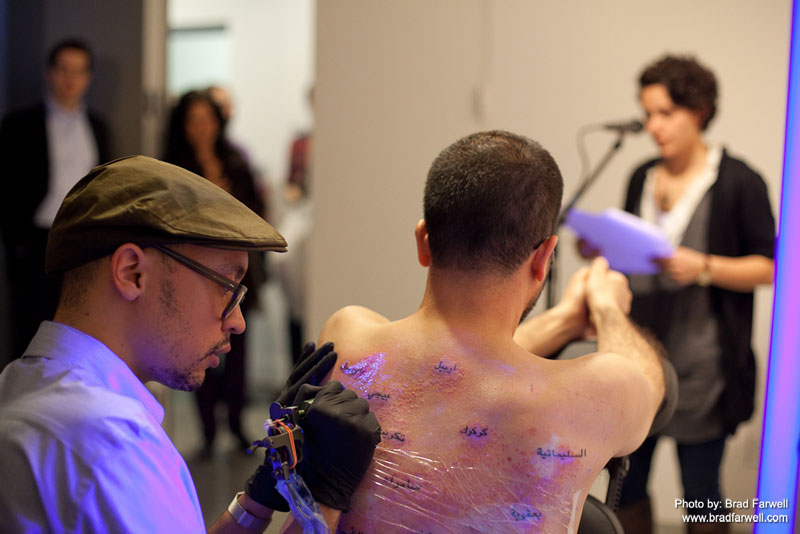
The tattoo itself consists of a map of geographical locations in Iraq, which has plotted on it 4,000 US soldiers in red ink and more than 100,000 civilians in ultraviolet ink (to symbolise how the death of Iraqis were invisible to the American public). You can read more on the project here.
– – –
While many of the examples I’ve listen are interesting and/or beautiful, there are of course some very bad applications of chart tattoos. So without further ado, let me present to you, this wonderful pig chart tattoo: